import { persist } from "../../../assets/scripts/workbook.js"

viewof working_ta1 = persist(
  "content/days/day-02/05-the-truth-the-whole-truth-and-nothing-but.qmd#working_ta1",
  Inputs.textarea({
  label: "Your working",
  placeholder: "Try the calculation yourself in this space before checking Technical Aid 2 on the next page. Use the Download button at the bottom of the page to save your working into your notes.",
  rows: 8
})
)THE TRUTH, THE WHOLE TRUTH, AND NOTHING BUT …
~ 16 min reading · ~ 45 min at Neave’s pace (~ 30 min on Stats-level 0)
It is time for me to come clean as to the nature of the “work” in the Red Beads Experiment, and how it is performed. This description is quite lengthy (more than three pages). It divides into roughly equal quarters (the second quarter beginning at “The training, part 1” below). So, in order to get things clear in your mind, I recommend that you read each of the four quarters two or three times before moving on to the next.
Let’s begin at the beginning. As I introduced the experiment, I made no secret of Dr Deming’s description of it as “stupidly simple”—indeed, I even gave delegates the page reference in Out of the Crisis! But I also pointed out to them that, in Dr Deming’s work, you often find things which are, at one and the same time, both simple and profound. The purpose of this experiment is to learn—and to have fun: there is nothing wrong with doing both, and indeed Dr Deming was most favourably disposed to that combination! Yes, the experiment contains humour, but it also contains profound messages. The audience will be invited to identify some of those profound messages after the experiment is concluded.
In the Major Activity near the end of the day, I shall ask you to write a comprehensive account of the messages that you will have learned from the various runs of the Red Beads Experiment introduced and discussed today. You would therefore be wise to start taking relevant notes now and continue to do so during the rest of the day in order to make that task easier for you to carry out when the time arrives.
To help discover the messages, members of the audience are invited to adopt a dual personality whilst the experiment is in progress. At one level, a very superior intelligence could be looking down at the experiment from on high, genuinely understanding absolutely everything there is to know about it. At the other level, the observer could be some inferior creature, e.g. an insect on the floor, with no possibility of comprehending what is going on—the situation is “way over his head”.
So the All-Knowing, looking down at the system from on high, has full comprehension of it. But to the Un-Knowing, looking up at it from floor level, it is far too large and complex for him to have any chance of understanding what is happening. Nevertheless, our Un-Knowing does have a brain—a rather special brain for an insect! Let us suppose that the Un-Knowing can recognise numbers, and can interpret them just as well as the average manager, politician, media reporter—or maybe even economist or accountant!
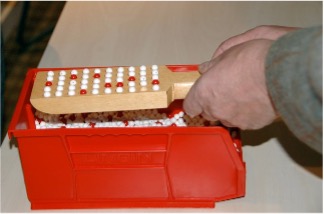
Going by what they see, the delegates will more naturally identify with the “All-Knowing” role. The apparatus for the experiment is most surely “stupidly simple”. There is a container half-filled with a large number of beads, differing only (as far as one can tell) in colour. 3,000 of the beads are white and the remaining 750 are red. Then there is a piece of wood or plastic: the so-called “paddle”. The paddle has 50 circular depressions sunk into it in a 5 × 10 pattern. There is also a bucket to help in a mixing operation. The only other apparatus provided is pens and paper and a couple of clipboards for the convenience of the junior inspectors.
The training, part 1
Of the two personalities mentioned above, the Foreman is in the “Un-Knowing” state—although he does not appear to appreciate the fact! In the context of this experiment, that is indeed the more realistic part for him to play. For who really fully understands the processes and systems for which they bear responsibility?
But, of course, both they and the Foreman in particular can understand and act upon numbers, can’t they? There’s even an acronym for it: MBR (Management By Results).
The Foreman may point out to the audience that the Inspection Department could appear to be relatively overstaffed: no less than three inspectors for just six Willing Workers. Do we really need half as many inspectors as production workers? The Foreman explains that this is, in fact, advisable because inspection is both a vital and a difficult task. Without accurate inspection data, how can the customer be protected—and how can the workers be compared and judged?
The Foreman now trains the Willing Workers. He checks and confirms that the workers are all prepared to put forth their best efforts to carry out their job as specified (recalling the qualifications stipulated for Willing Workers in the recruitment advertisement on page 9, in A Brief Overview). And so he shows them what to do: their close attention is demanded—not everybody can do this job (as they will soon discover). The job is to make white beads; the customer will not take red. A strictly rigid procedure is defined—in order to avoid variation. Clearly, with a rigidly defined procedure, and appropriate training to learn that procedure, any subsequent variation in performance will then be a worker’s own fault. It is assumed that the company is ISO 9000 registered, so there exists full documentation, traceability, accountability, definition of the quality system, a huge reference manual (from which this procedure is taken), etc.
As mentioned earlier, the work standard is 50 items of production per worker per week. In order to help the workers precisely attain this standard, the Foreman will provide the workers with the “paddle” which is illustrated on the previous page. Recall that there are exactly 50 depressions in the top of the paddle.
Before each worker performs the task, a mixing operation is to be carried out, and so this is now demonstrated by the Foreman. It consists of tipping all the beads from the container into the bucket and then back into the container. (The system uses gravity—fortunately a cheap and plentiful resource.) The worker (or, during the demonstration, the Foreman) takes the paddle and places it on the edge of the container, holding it at a specified angle of 44° to the horizontal. The paddle is then gently but firmly pushed into the beads, with its slope allowed to steadily decrease to nearly horizontal. Great care must be exercised during this procedure. The 50 depressions will now be entirely covered by the beads. The paddle should next be raised back to that same angle of 44° with the horizontal. Then, retaining that angle, the paddle is drawn out from the beads. 50 beads will have been caught in the holes in the paddle. There may be some surplus beads sitting on top of the paddle; if so, they must be shaken off by gently tapping the paddle against the sides of the container. It is vital that the paddle be raised to 44° before withdrawing it from the beads—for otherwise there may soon be some beads rolling around the table and onto the floor.
The training, part 2
The 50 beads are the workers’ production for that week, the white and red beads being good and bad product respectively. Having demonstrated the operation himself, the Foreman takes the paddle over to the workers to show them what he has produced. He points out his large majority of good white product, and also states that he has included just a few defective red product so that they can see and be clear about what they need to avoid making.
The Foreman then takes the paddle over to the Inspection Department, so that both the junior inspectors and the Chief Inspector can learn their jobs. Inspection can be a tedious operation, thus increasing the chance of human error. He therefore gets the two junior inspectors, independently of each other, to count and write down the number of red beads they see in the paddle. The Chief Inspector then compares their two results. There are, of course, two possibilities: the two numbers may be the same or they may be different. If the numbers are different, a mistake has been made. If the numbers are equal, it is possible that two mistakes have been made! However, for the purposes of this experiment, such independent agreement between the two junior inspectors provides an operational definition (discussed on Day 11) of the number of red beads to be reported and recorded. (Dr Deming often pointed out that this independence of the two counts is about the only thing that management gets right in the whole experiment! If you’re interested in why, see the paragraph in the middle of DemDim page 107.) Accordingly, if the numbers are not the same, the two junior inspectors are told to try again, still independently of each other—as often as necessary to obtain agreement. When their two numbers agree, the Chief Inspector reports that number of defectives to both the Foreman and the Recorder.
The 50 beads are then returned to the container in order that the working conditions remain the same for everybody (for how else could their results be fairly compared with each other’s?).
Now that both the inspectors and the workers have received their training, we are nearly ready for the real work to commence. Before that, the Foreman has a few final words of encouragement for the workforce. First, so that they know what is expected of them, he sets the goal of no more than five defectives out of their 50 items. Next, he makes clear to each of them that the future of their job depends upon their performance. Do they understand that there is a lot of competition for this work? Every week may be their last on this job. He is (of course) looking for results. From now on (recalling again that the recruitment advertisement stipulated the Willing Workers must be willing and able to obey orders without question or argument) there will be no talking, no comments, no backchat, no questions. They are simply to do their jobs as they have now been trained. They are not allowed to resign. But, of course, anybody who performs badly or who violates the instructions, etc, may be “let go”.
Oh, and finally, he wishes them good luck and trusts that they will enjoy their work!
The “real work”
And so the real work commences. The workers come forward, one by one, to carry out their task under the watchful eye of the Foreman. He looks out for things to criticise. The initial angle may be wrong; the action may be jerky, or too fast, or too slow; the paddle may be lowered at the wrong rate; the paddle may not be inserted far enough into the container; the withdrawal angle may be wrong; instead of “gently tapping” the paddle to get rid of any surplus beads, the action may be too rough; the worker might try to tip the paddle, or shake it up and down rather than side to side. Of course, if the worker produces very few red beads, perhaps even meeting the quota of five or less, the Foreman instead congratulates the worker’s care, concentration and obedience to the details of the procedure.
In the case of such a good result being announced by the Chief Inspector, the audience often automatically applauds and cheers even before the Foreman has the chance to offer his praise. And, on the other hand, a high score (such as Pat’s at the end of the second week) may be greeted by good-humoured derision or even, on occasions (rather depending on how the Foreman is acting his part), by some genuine feelings of embarrassment.
As you will have realised some time ago, no worker has much control over the results which he produces! Most would agree that he actually has none at all; others might argue that, by some judicious steering of the paddle into the container, he could conceivably be able to influence the result just a little. Whichever is the case, it is clear to all that the Experiment on Red Beads is an elaborate charade. Just about everything that is said and done in the production process is irrelevant to the results obtained. But that’s from the viewpoint of the All-Knowing … . From the Un-Knowing level, there is no suspicion of it just being a charade. Everything that happens and everything that is said seems eminently reasonable. Of course it is sensible to define a rigid procedure so as to reduce variation by permitting no deviation. Of course the workers should be trained to carry out the work with discipline and consistency. Of course it is wise to specify how each phase of the operation is to be carried out. Of course it makes sense to set quotas. Of course it is right to criticise poor results and praise good ones. Of course it is necessary to appraise performance. Of course it is justifiable to fire workers with the worst results. Of course!
But now here’s a different “Of course”. Of course, if our Un-Knowing friend wasn’t totally unknowing, but had one special piece of knowledge, he might stand a chance of realising that those thoughts in the previous paragraph are all nonsense—even without understanding any technical details of the work at all. What would that special piece of knowledge be? How to draw a control chart and interpret it.
We have already seen on page 15, in Our First Control Chart the control chart for the results recorded by Dec, and what it tells us in the Pause for Thought 2–e. (If you need reminding, look again at the bottom of Appendix page 7.) Now, if we slip into the role of the All-Knowing, we know that what the control chart told us is surely true. How could this process of drawing 50 beads out of the container be anything other than in statistical control, i.e. stable? In fact, it must be one of the most stable processes imaginable! So it is indeed true that, as was stated in the Appendix, “essentially all the variation in the results is due to common causes, to the system, not in any way to the Willing Workers”. The control chart has told the Un-Knowing what the All-Knowing already knew to be true! In most practical situations, of course, we do not have the benefit of the All-Knowing’s knowledge. So we need to be guided by the control chart’s intelligence instead. And it doesn’t often let us down.
So let us summarise. If the control chart of data from the experiment indicates that the process is in statistical control then this tells us that effectively all of the variation is coming from the system—with the Willing Workers being at the mercy of that system. When they carry out their task, the fact is that whether they get a good result or a bad result is merely a matter of luck. Should we praise them for simply being lucky? Should we criticise them for being unlucky? What use could it be to appraise their performance when the variation comes from the system? None. How could it be justified? It cannot.
The Technical Aids
We have now reached the first of the Technical Aids to be included in Days 2 and 3. Here, Technical Aids 1 and 2 describe how the control limits are computed for control charts that are based on the type of data produced and recorded in Red Beads Experiments. Technical Aid 3 contains a warning that, although control limits for all kinds of data are based on similar reasoning, some of the fine detail will vary according to the particular type of data being recorded. Hence the method described here is not generally applicable to many other types of data. This matter will be pursued on Day 3.
Let me remind you that those who have opted for Stats-level 0 are invited to skip the Technical Aids! Thus, if you have elected to be on Stats-level 0 (or 00), please now move straight on to page 22, at the start of Your Turn.
Technical Aid 1
One of the earliest applications of Shewhart’s invention of the control chart was for batch inspection of mass production processes. In such inspection, samples (batches) of \(n\) items from the process’s output are regularly drawn and inspected, and the number \(X\) of defective items recorded. After several samples have been inspected, the control limits are computed as follows.
Using the statistician’s traditional shorthand for averages, \(\bar{X}\) represents the average number of defectives found in the samples so far, while \(\bar{p} = \bar{X} \div n\) is the average proportion of defectives in those samples. Shewhart’s guidance about control limits then leads to the upper and lower limits being placed at
\[ \text{UCL} = \bar{X} + 3\sqrt{\bar{X}(1-\bar{p})} \]
and
\[ \text{LCL} = \bar{X} - 3\sqrt{\bar{X}(1-\bar{p})} \]
See if you can use this method to obtain the control limits quoted on page 14, in Our First Control Chart and drawn on page 15, in Our First Control Chart. Use all 24 numbers of red beads in your calculation. (If you need help, the computations are sketched out in Technical Aid 2 on the next page—but try it by yourself first in the space at the top of the page.)
Technical Aid 2
Firstly, notice that Dec recorded the total number of red beads obtained in the experiment near the bottom right of his table on page 11, in A Brief Overview: it was 235. But now you’ll need your calculator.
The average number of red beads obtained by the Willing Workers was \(\overline{X} = 235 \div 24 = 9.792\).
Since the paddle contained \(n = 50\) beads each time, the average proportion of red beads was \(\overline{p} = \overline{X} \div n = 9.792 \div 50 = 0.1958\) which gives \(1 - \overline{p} = 0.8042\).
So \(\overline{X}(1-\overline{p}) = 9.792 \times 0.8042 = 7.8747264\) and \(\sqrt{\overline{X}(1-\overline{p})} = \sqrt{7.8747264} = 2.8062\).
Finally, the distance from \(\overline{X}\) out to the two control limits is \(3\sqrt{\overline{X}(1-\overline{p})} = 3 \times 2.8062 = 8.419\). This gives the upper and lower control limits as UCL \(= \overline{X} + 3\sqrt{\overline{X}(1-\overline{p})} = 9.792 + 8.419 = 18.21\) and LCL \(= \overline{X} - 3\sqrt{\overline{X}(1-\overline{p})} = 9.792 - 8.419 = 1.37\).
Technical Aid 3
If during Day 1 you read the discussion in the Appendix about the first paradox then you may recall Dr Deming’s mention of Shewhart’s “3σ-limits” (σ is a Greek letter, pronounced “sigma”). The control limits that you have just computed follow Shewhart’s guidance by using \(\sigma = \sqrt{\overline{X}(1-\overline{p})}\). The reason for this particular choice when the data come from batch inspection as in the Red Beads Experiment will, I’m afraid, have to be reserved for pages 85–88, starting with “More on the binomial and normal distributions” in the Optional Extras section.
As mentioned earlier, it is important to emphasise that this particular choice of σ does not apply to many other kinds of process data. A method that can be employed much more generally will be used tomorrow and is also introduced, discussed and illustrated in the Springboard article (cited on Day 1 page 8).