A SYSTEM …
~ 12 min reading · ~ 30 min at Neave’s pace
A SYSTEM …
Learning about what Dr Deming meant by a “system” can be described as “double-value-for-money” learning, since this is crucial in two senses in the study and understanding of what he taught:
- appreciating the Deming philosophy as a system, and
- appreciating an organisation as a system.
The former has been an ever-present and developing theme throughout this course. The Activities during the Second Project which occupies all of Days 10 and 11 will also repeatedly return us to that theme. But during both this morning and tomorrow morning we shall concentrate more particularly on the second aspect. This morning provides some broad and fundamental thoughts about appreciating an organisation as a system, while tomorrow morning we shall get down to more detail.
Had I ever produced a new edition of DemDim, one change I’d surely have made would be to put the topic of “Appreciation for a System” much more “up-front”. Except for the appropriate section in my System of Profound Knowledge chapter (Chapter 18), the most relevant writing is tucked away in Chapter 8: “Processes and Systems”, which is in the middle of the already substantial Part 2 of the book.
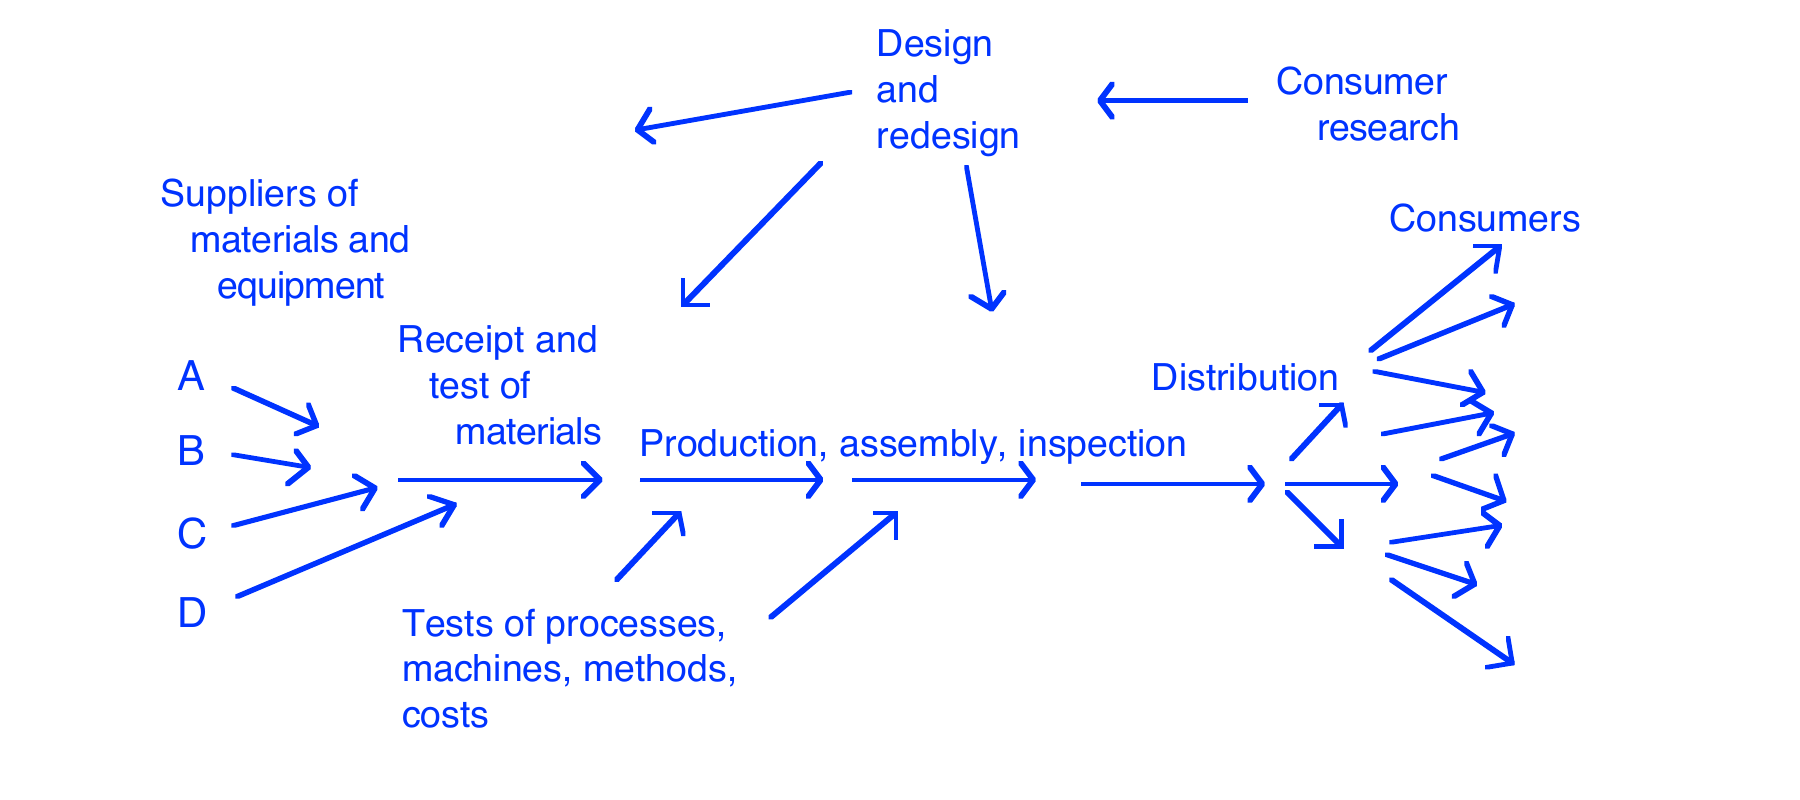
Why did it finish up there there? Simply because at the time of writing DemDim (1989–90), although realising the topic was important, I had still not realised how overwhelmingly important it is. I should perhaps have been alerted by the position of the “Organisation Viewed as a System” flow diagram in Out of the Crisis—as early as page 3[4] in a book of over 400[500] pages. Furthermore, lacking sufficient powers of clairvoyance, I could not foresee that, two years later, I would discover it to be Number 1 in the “Summary of Teachings to Top Management and to Engineers in Japan” in Mrs Kilian’s biography! But, despite these pointers, Dr Deming himself did not seem to place as much emphasis on it when I was first involved with him as he did later on. So maybe I have some excuse! As promised, here is the famous diagram again:
Describe this diagram
The famous “Organisation Viewed as a System” flow sketch — the same diagram Deming put on the blackboard at every Japanese top-management conference from 1950 onward, here reproduced in his hand-drawn-style blue. Materials and equipment from four suppliers (A, B, C, D) flow into Receipt and test of materials, then into Production, assembly, inspection, then into Distribution, and out to many Consumers (a fan of arrows, deliberately depicting one organisation serving many). Two feedback loops sit on top: Tests of processes, machines, methods, costs feeds back into Receipt and Production, and Consumer research flows backwards through Design and redesign to inform Receipt, Production and Distribution. The lesson is that organisation, suppliers and consumers form a single system, with information flowing from the consumer end back through the rest — not a one-way assembly line.
Note that, with his usual precise choice of words, Deming does not write “Customers” at the right-hand side of this diagram, but “Consumers”. “Customer–Supplier Relationships” is an often-used phrase. However, the “customer” strictly refers to who pays for what is being bought rather than necessarily who uses it. Clearly it is the experience of, and information from, the consumer that is needed to aid the improvement implicit in the use of the flow diagram.
What ignited Japan?
But there was certainly no doubt about the importance of the flow diagram in Deming’s teaching later on. I’ll refer here to a meeting held at the Queen Elizabeth Conference Centre, London in July 1990 that was jointly arranged by the European Federation for Quality Management and the British Deming Association. It was attended by top management representatives of around 20 “big-name” European companies. To those senior executives, Dr Deming simply said of the “Organisation Viewed as a System” flow diagram:
“I believe that this diagram made the difference in Japan.”
Quite a claim for a single and not particularly complicated sketch! Did he really mean it—that just that diagram (and, obviously, the learning which it portrays) had made the difference in Japan?
Yes, he did. If you read The New Economics page 41[57] then you’ll be left in no doubt. There you will find a section headed with the question: “What ignited Japan?”. The section begins as follows—and this not only makes the claim but also explains why he made it:
“The flow diagram … was the spark that in 1950 and onward turned Japan around. It displayed to top management and to engineers a system of production. The Japanese had knowledge, great knowledge, but it was in bits and pieces, uncoordinated. This flow diagram directed their knowledge and efforts into a system of production, geared to the market—namely, prediction of needs of customers. The whole world knows about the results.
This simple flow diagram was on the blackboard at every conference with top management in 1950 and onward. It was on the blackboard in the teaching of engineers.
Action began to take place when top management and engineers saw how to use their knowledge.”
That extract is versed in the context of production. Indeed, Dr Deming’s own title for the flow diagram on Out of the Crisis page 3[4] was “Production Viewed as a System”. I prefer the more generic “Organisation Viewed as a System”, for the concept is surely universal. In fact, within the small print under the diagram in Out of the Crisis, Dr Deming indicated such a universal nature by remarking how the diagram can easily be amended to apply to a service organisation by just changing a few words. That small-print description is well worth reproducing in full:
“Figure 1. Production viewed as a system. Improvement of quality envelops the entire production line, from incoming materials to the consumer, and redesign of product and service for the future. This chart was first used in August 1950 at a conference with top management at the Hotel de Yama on Mount Hakone in Japan. In a service organisation, the sources A, B, C, etc, could be sources of data, or work from preceding operations, such as charges (as in a department store), calculation of charges, deposits, withdrawals, inventories in and out, transcriptions, shipping orders, and the like.”
The “Old Way” and the “New Way”
As we know, Dr Deming attributed to Walter Shewhart the origin of much of his thinking—i.e. considerably more than just the statistical content.
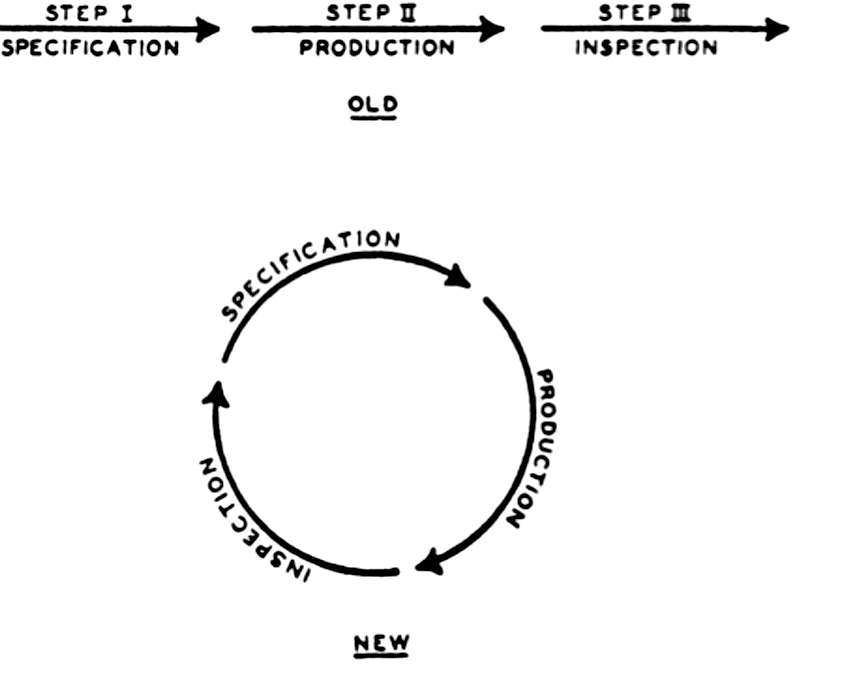
And who could doubt that that was true of his thoughts on “Production (or The Organisation) Viewed as a System” after seeing the diagram alongside? This is reproduced from page 45 of Shewhart’s 1939 book: Statistical Method from the Viewpoint of Quality Control.
Describe this diagram
Shewhart’s 1939 “OLD” vs “NEW” sketch, two diagrams stacked. OLD: three boxes joined by straight arrows in a single line — Step I Specification, Step II Production, Step III Inspection. The line ends; nothing comes back. NEW: the same three labels (Specification, Production, Inspection) but now arranged around a circle, each arrow leading to the next and the third leading back to the first. The whole pedagogical point is the difference between a line and a circle: the line stops; the circle turns Inspection into a feedback step that reshapes the next round of Specification, making continual improvement possible.
Were there a prize for the best-ever combination of simple and profound, this would be strong competition for the Experiment on Red Beads! Again, Shewhart was primarily concerned here with manufacturing applications, which explains his choice of the particular three words used in the two parts of the diagram. But that’s not what is most important.
PAUSE FOR THOUGHT 9–b
What kind of things does that simple change from a line to a circle signify to you?
The “Old Way”
You do this (Step 1), then you do that (Step 2), then you do something else (Step 3)—and that’s it! Done; finished; gone. And later, presumably you may do something similar again, one or more times. And each time it’s simply: done; finished; gone!
The “New Way”
The circle immediately creates thoughts of feedback, learning, improvement. Having gone around the circle once, Step 3 leads back into Step 1. We learn from what happened the first time around and, as a result, we may appropriately alter (improve) Step 1, according to what has just been learned. And that in turn is likely to alter (improve) what happens in Step 2, which is likely to alter (improve) what happens in Step 3. And the learning from that second cycle is fed into the third cycle, improving what happens throughout yet further.
Very simple, yes—but profoundly important.
Sadly, despite it now being more than three-quarters of a century since Shewhart wrote his book, the fact is that, as regards so much of what goes on in many organisations, there are still many more lines than circles—many more “Old Way”s than “New Way”s.
“A dynamic scientific process of acquiring knowledge”
As Dr Deming pointed out, Walter Shewhart’s own language is often not easy to understand. In addition, in his 1939 book, Shewhart was concerned with expressing things in statistical terms, as implied by its title which, recall, was: Statistical Method from the Viewpoint of Quality Control.
But I’d like to quote a couple of extracts from his discussion on the “Old” and the “New” Ways whose message soon becomes crystal-clear. On page 44 of his 1939 book he expresses these thoughts in terms of two types of “science”:
“On the older concept of an exact science these three steps … would be independent. One could specify what he wanted, someone else could take this specification as a guide and make the thing, and an inspector or quality judge could measure the thing to see if it met specifications. A beautifully simple picture!”
But he then goes on to point out that …
“The whole picture, however, is radically different just as soon as we admit that we only have a probable science.”
By an “exact” science he implies there is neither variation nor interdependence involved. But with a “probable” science there is variation to contend with along with interdependence between the steps. In particular, variation in one step is caused by variation in previous steps and causes variation in future steps. Thus Shewhart argues that
“In fact these three steps must go in a circle instead of in a straight line.”
And having done that, with the resulting change in thought and action, he now observes …
“The three steps constitute a dynamic scientific process of acquiring knowledge.”
A dynamic scientific process of acquiring knowledge! Rather different from done; finished; gone! And this was back in 1939—hardly “rocket science”! But eminently profound. No wonder Dr Deming always spoke of Walter Shewhart with such warmth and gratitude.
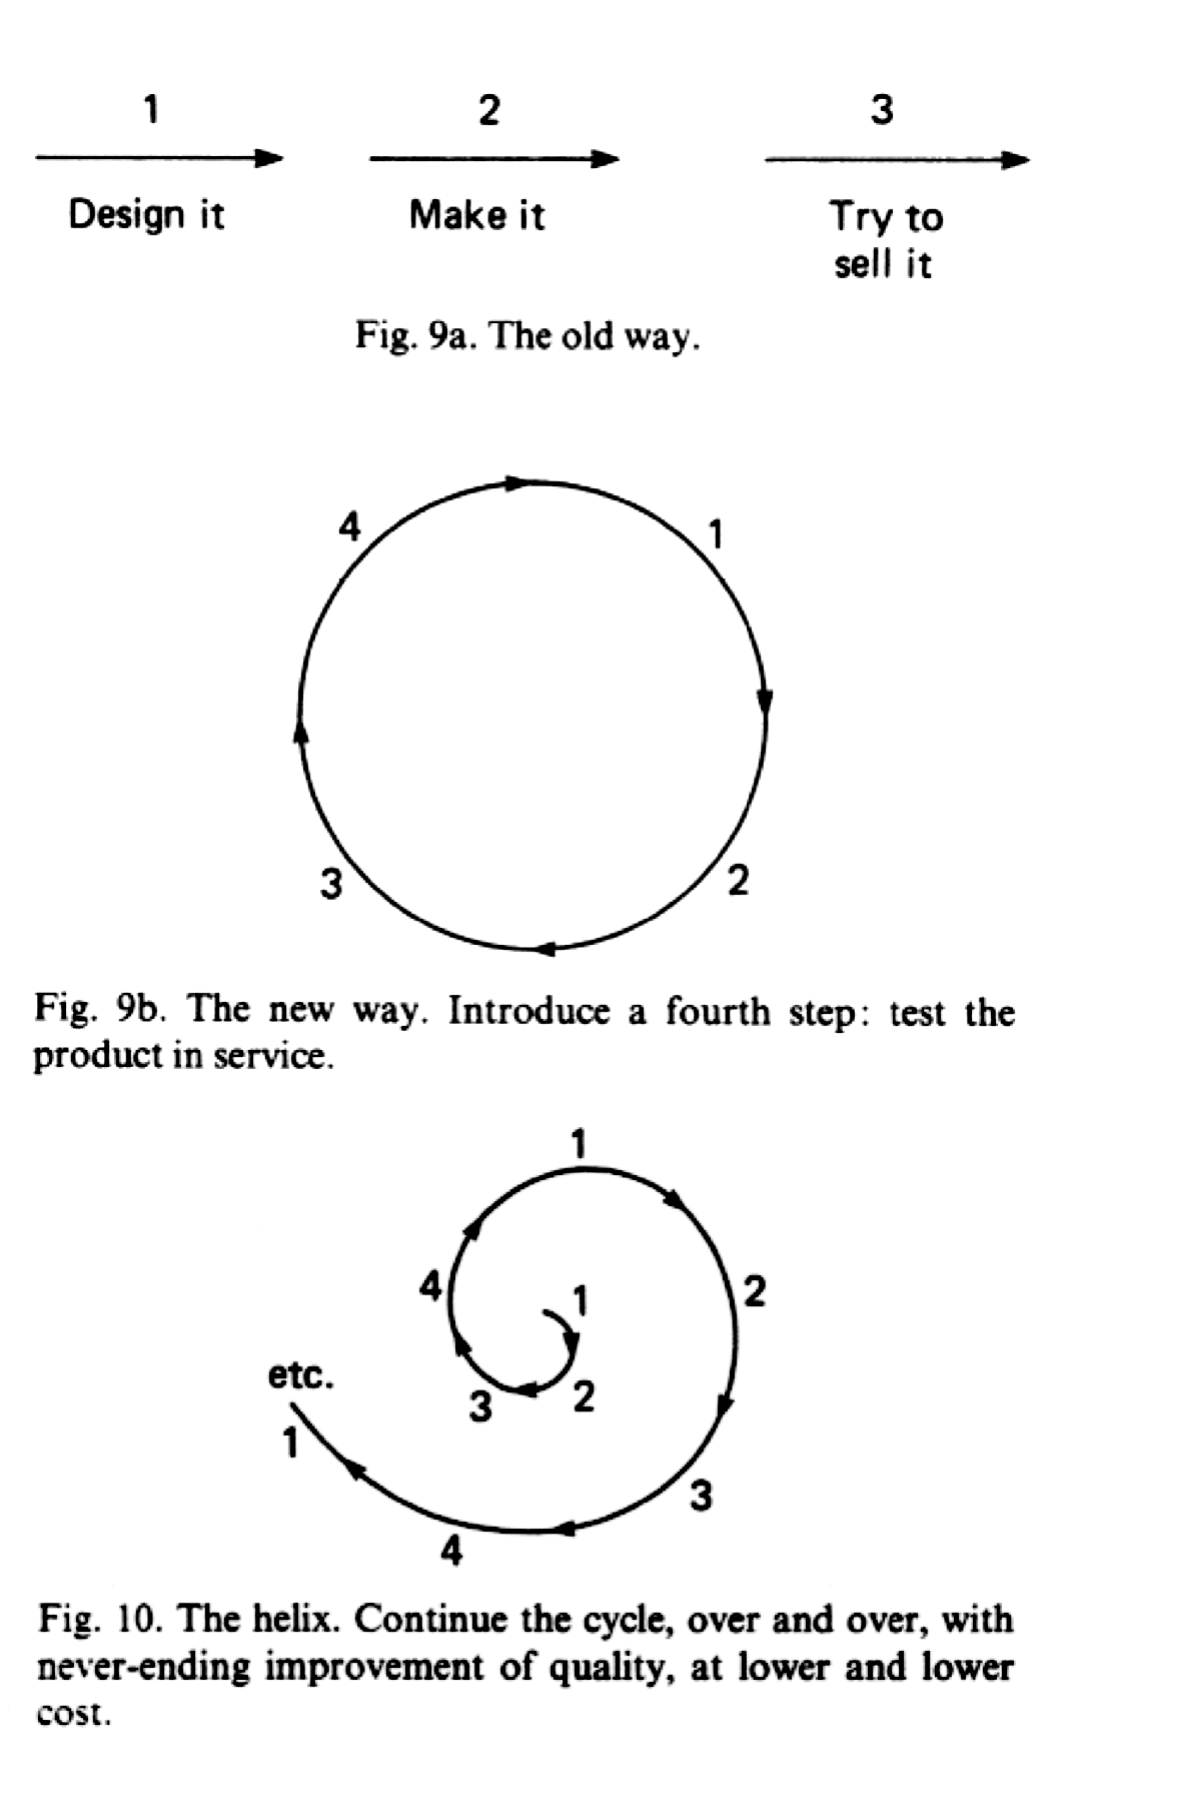
After referencing Shewhart’s work just described, on Out of the Crisis pages 154–155[180–181] Dr Deming then goes on in his Figure 9 to reproduce the same concepts with some different words: simpler ones for the “Old Way” and a crucial expansion of the “New Way”:
Describe this diagram
Three sketches stacked vertically, all from Out of the Crisis. Fig. 9a (the old way): a straight line of three numbered arrows — Design it → Make it → Try to sell it. The line ends at “sell it”; there is no return path. Fig. 9b (the new way): a circle with four numbered points equally spaced around it; Deming’s key change from Shewhart is that he adds a fourth step, test the product in service, so consumer feedback feeds back into Step 1. Fig. 10 (the helix): the same four-step circle, but now drawn as a spiral expanding outward — round and round, each cycle larger than the last — depicting “never-ending improvement of quality, at lower and lower cost”. The trio shows the progression: line → circle → helix.
He follows this with:
“Continuation of the four steps leads to a helix of continual improvement of satisfaction of the consumer, at a lower and lower cost”
and then illustrates such a helix in his Figure 10.
What better and simpler way could there be of depicting the cumulative and multiplying effects of genuine improvements and the resulting increases in knowledge, understanding and ability? And even this has its origins in Shewhart (1939, page 45) where, still talking of the three steps, he wrote:
“From this viewpoint, it might be better to show them as forming a sort of spiral.”
For further emphasis, Deming then reiterates the point just made (Out of the Crisis page 154[181]):
“Through improvement of quality, guided by consumer research, the ultimate result is not only better quality but also lower cost and improvement of competitive position.”
And where do we find ourselves? Surely we are back yet again at the Deming Chain Reaction (DemDim page 33). Further, that development of the “helix” leads directly to what Deming (unlike others) always called the “Shewhart Cycle” which we shall study on Day 11.
PAUSE FOR THOUGHT 9–a
So what is the important difference between the “Old Way” and the “New Way”?
It’s simply the difference between a line and a circle! The line stops (or disappears). But the circle keeps going round.