INTRODUCTION TO THE MAJOR ACTIVITY
~ 23 min reading
Had I not already given the game away earlier, you might have suspected that today’s Major Activity would be similar to the First Project on Days 4 and 5, simply replacing the three foundations of the Joiner Triangle by the three “New Climate” topics that you have now been studying. Indeed, I often gave my seminar delegates such a challenge, and it always turned out to be very fruitful. So, in the unlikely event that you have time to spare, that is something else you might like to try!
Instead however, as described earlier, the Major Activity here is based on the idea of the exercise which occupies the final nine pages of DemDim Chapter 15. This exercise has rather a good pedigree: some three years later, Dr Deming was kind enough to reproduce much of my presentation of the exercise as it appears in DemDim (although with some differences in detail) in his own presentation on The New Economics pages 57–60[82–87].
Before you spot them, I will confess to a couple of silly errors. Near the bottom of DemDim page 232 I should have stated the year 1988 rather than 1987, and “education” would have been more appropriate than “training” near the top of DemDim page 239. Heigh-ho: another lesson to learn is that, however much one may strive for perfection, it is rarely achieved.
As with the exercise in DemDim, you will proceed through this Major Activity by filling in a sequence of tables. Although there are, of course, some similarities between the tables here and those in DemDim, they could not be exactly the same since obviously I cannot know your answers in advance. But, however the tables are designed, it is always necessary when starting to fill in a new table (except, of course, for the first) to copy over some material from one or two of the previous tables. Obviously, when the tables are all bound together as in a book, that would involve a lot of turning backward and forward between the pages—which can become rather tedious. This is why I suggested on today’s page 3, in the Outline of Today’s Work that separate single-sided copies of the tables would be preferable: they will avoid all that page-turning. (You could work throughout with a single table and thus avoid the copying over. However, this would involve a lot of crossing things out or erasing them, resulting in a rather messy end-product. As a result, when you look back over the Activity, you might well find it rather difficult to see exactly what you’ve done!)
As an introduction to the Activity, please now read the final section of DemDim Chapter 15 (pages 232–240). Read it reasonably carefully in order to get the general idea. But you do not need to take in every detail since, as just indicated, the versions of the tables that we’ll use this afternoon are somewhat different from those in DemDim. Nevertheless, the overall approach and the lessons to be learned from the two versions are the same. The fundamental point is that if, say, Area A does something which harms Area B, i.e. makes its work more difficult, lowers its quality and reliability, etc, that harm then also harms Area B’s “consumers”, be they internal or external. And so the harm done carries on spreading, thus harming the operation of the system, i.e. of the organisation, as a whole.
I shall begin this afternoon by running through the DemDim illustration again but also introducing you to the version of the tables that I shall ask you to work with in the subsequent Major Activity. In the latter you will develop this exercise in the context of your own organisation.
I strongly recommend that you use one of your duplicate sets of tables to mimic the DemDim illustration as we go through it this afternoon, starting on page 13, below. That will help you to familiarise yourself with the method and procedure that we are using with these tables. Thus, when you subsequently start to work on your own illustrations, that prior “on-hand” experience will better enable you to concentrate more on their substance and on what there is to learn from the exercise rather than on the mere mechanics of the procedure.
INTRODUCTION TO THE MAJOR ACTIVITY (continued)
The very first paragraph in the final section of DemDim Chapter 15 that I asked you to read just before the lunch-break is so important that Dr Deming reproduced it virtually word-for-word when introducing the same exercise on The New Economics pages 57–58[82–83]. Here is his version:
“Illustration of selfish competition versus cooperation between departments. Harm comes from internal competition and conflict, and from the fear that is thereby generated. A manager of purchasing, under pressure to reduce costs, changes to a cheaper source. Engineering Design imposes unnecessarily tight tolerances to compensate for the fact that Manufacturing never reaches the standards asked of it. Departments performing better than budget start spending near the end of the year because they know that otherwise their next year’s budget will be reduced. As the end of the month looms, salesmen start doing everything they can to meet their quotas, with scant regard to the problems caused to Manufacturing, Administration, and Delivery, let alone to the customer. Figures are massaged, computations redefined, so that reports show more of what senior management wish to see.”
For added authenticity I shall refer to Dr Deming’s wording in what follows. I think you may already have realised how this description contains clear echoes of Gallery Furniture as it was during the 1980s!
Let’s recall the main points of what you will have seen in that section from DemDim: a story essentially told by the succession of tables in Figures 43–48. In the way that the tables are laid out there you saw that, in a sense, the exercise takes the organisation “from darkness into light” regarding understanding and application of the Deming philosophy. The shaded (“dark”) sections in those tables indicate possibilities that are initially not being considered or, later, have been rejected as not being of benefit to the organisation. So, with Figure 48 (DemDim page 238) in particular, the “huge financial advantages” in the title of the exercise become available by only adopting the options in the “light” parts of that table.
The presumption is made here that the organisation starts out entirely at the dark end of the dark-to-light spectrum. The same presumption will be made in the Major Activity concerning your own organisation, and so the layout in the Major Activity will reflect this.
On the other hand, if you are fortunate enough to be in an organisation that is not completely at the dark end of the spectrum, you can enjoy yourself by initially pretending that it is! So think of what the areas might be coming up with if self-protection and self-interest were the name of the game rather than the good of the organisation as a whole. Of course, it might just be that that description reminds you of an organisation for which you previously worked! If so, you could use that as “your organisation” here.
It may be helpful if I quote to you a further extract from Mack’s Gallery Furniture presentations that I did not include in the abridged account on Day 6:
“Before, in the 1980s, we managed the business with chimneys of excellence. Every department had a quota and a budget, and they were expected to stand up by themselves. We had the Sales Department, we had the Pick-Up Department, Data-Processing, Receiving, the Delivery Department, the Back Office. And every one of them had their own little chimney of excellence, and they would never talk to the other departments; they were almost in competition with each other.”
Get the picture? Sound familiar? That is the dark end of the spectrum.
So, as you have seen, the envisaged situation is this. Various proposals for development are being considered by each department or section or group (for which I’ll generally use the word “area”) in the organisation. The exercise takes the organisation through three phases, these phases reflecting the organisation’s (particularly its management’s) developing understanding and use of Deming’s teaching. We then study how decisions are made in each of those three phases and their consequences in terms of total gain or loss for the organisation as a whole.
Now, the version of the exercise as laid out in both DemDim and The New Economics is admittedly rather basic, not to say crude! But it serves its purpose in demonstrating the main kinds of differences that result from the three phases and their consequences. So I shall stick to this basic version for the time being in order for you to see how the same results as those in either book are obtained when using the tables provided in this Activity. Then, when moving on to your own use of the exercise, I’ll suggest some amendments that you might like to adopt in order to make the exercise less basic and more flexible and realistic.
The first of the three phases is the “darkness” phase; this reflects the description in Deming’s paragraph reproduced on the previous page. In its decision-making and its choice of strategies, procedures and operations (for which I’ll generally use the word “options”), each area is simply focused on what will be best for itself, irrespective of harm which might be caused elsewhere. It’s as far away as can be imagined from the Joiner Triangle’s “All One Team” and from “Cooperation: Win-Win”. You might like to look back to Deming’s paragraph to confirm that this is indeed the case. Such an approach is often not the “fault” of those involved in the decision-making: it is simply a consequence of the organisation’s management style, culture, methods, and attitude to appraisal and to reward (or the opposite), etc.
In the second phase, there is now some understanding of Deming’s fundamental concept of viewing the organisation as a system. Recall the hugely important flow diagram on Day 1 page 35 which appeared on that page as the very first item in his list of “A Summary of Teachings to Top Management and to Engineers in Japan”. For those in the area considering adopting a certain option, this change immediately refocuses their attention from being wholly concerned with the effect of that option within their own area to also appreciating its likely effects elsewhere in the organisation. Even though the option appears likely to be beneficial within, should it unfortunately appear likely to be too detrimental elsewhere then that option will now be rejected (whereas it would have been happily accepted during the first phase). The consequence of this change of attitude is twofold: (a) less options are now adopted than would have been the case in the first phase, thus involving less work, disruption and change, and yet (b) the organisation as a whole is better off than it would have been if the options initially being considered had all been adopted. Sounds like win-win to me!
So what’s the third phase? This is the one that really reflects Deming’s phrase (see Day 1 page 27): “transformation of Western style of management” (although the style of management that could do with transformation is hardly unique to the West!). In the second phase, although the various areas now also consider the likely effects of their proposals elsewhere in the organisation, they are still only considering possibilities that appear directly advantageous to their own area. What’s new in the third phase is that they also start to consider options which, on the face of it, are disadvantageous to their own area but will still be adopted if the gains elsewhere warrant it. The exercise demonstrates that this produces yet further gains for the organisation as a whole. An obvious example is where Purchasing now decides to buy something more expensive than before if its superior quality and reliability etc are worth it.
So let’s now take a look at the tables provided in this Major Activity. As I mentioned on page 10, above, there are similarities with, but also differences from, the tables in DemDim. To avoid confusion you may therefore now largely prefer to ignore the book version: to help you do that, where there are such differences I’ll now mostly place references to them in brackets. Also to help reduce any confusion, in future I shall:
refer to the DemDim tables by their Figure numbers 43–48, not their Table numbers 1–6; and
refer to the table numbers here in words, i.e. Table One, Table Two, …, up to Table Five.
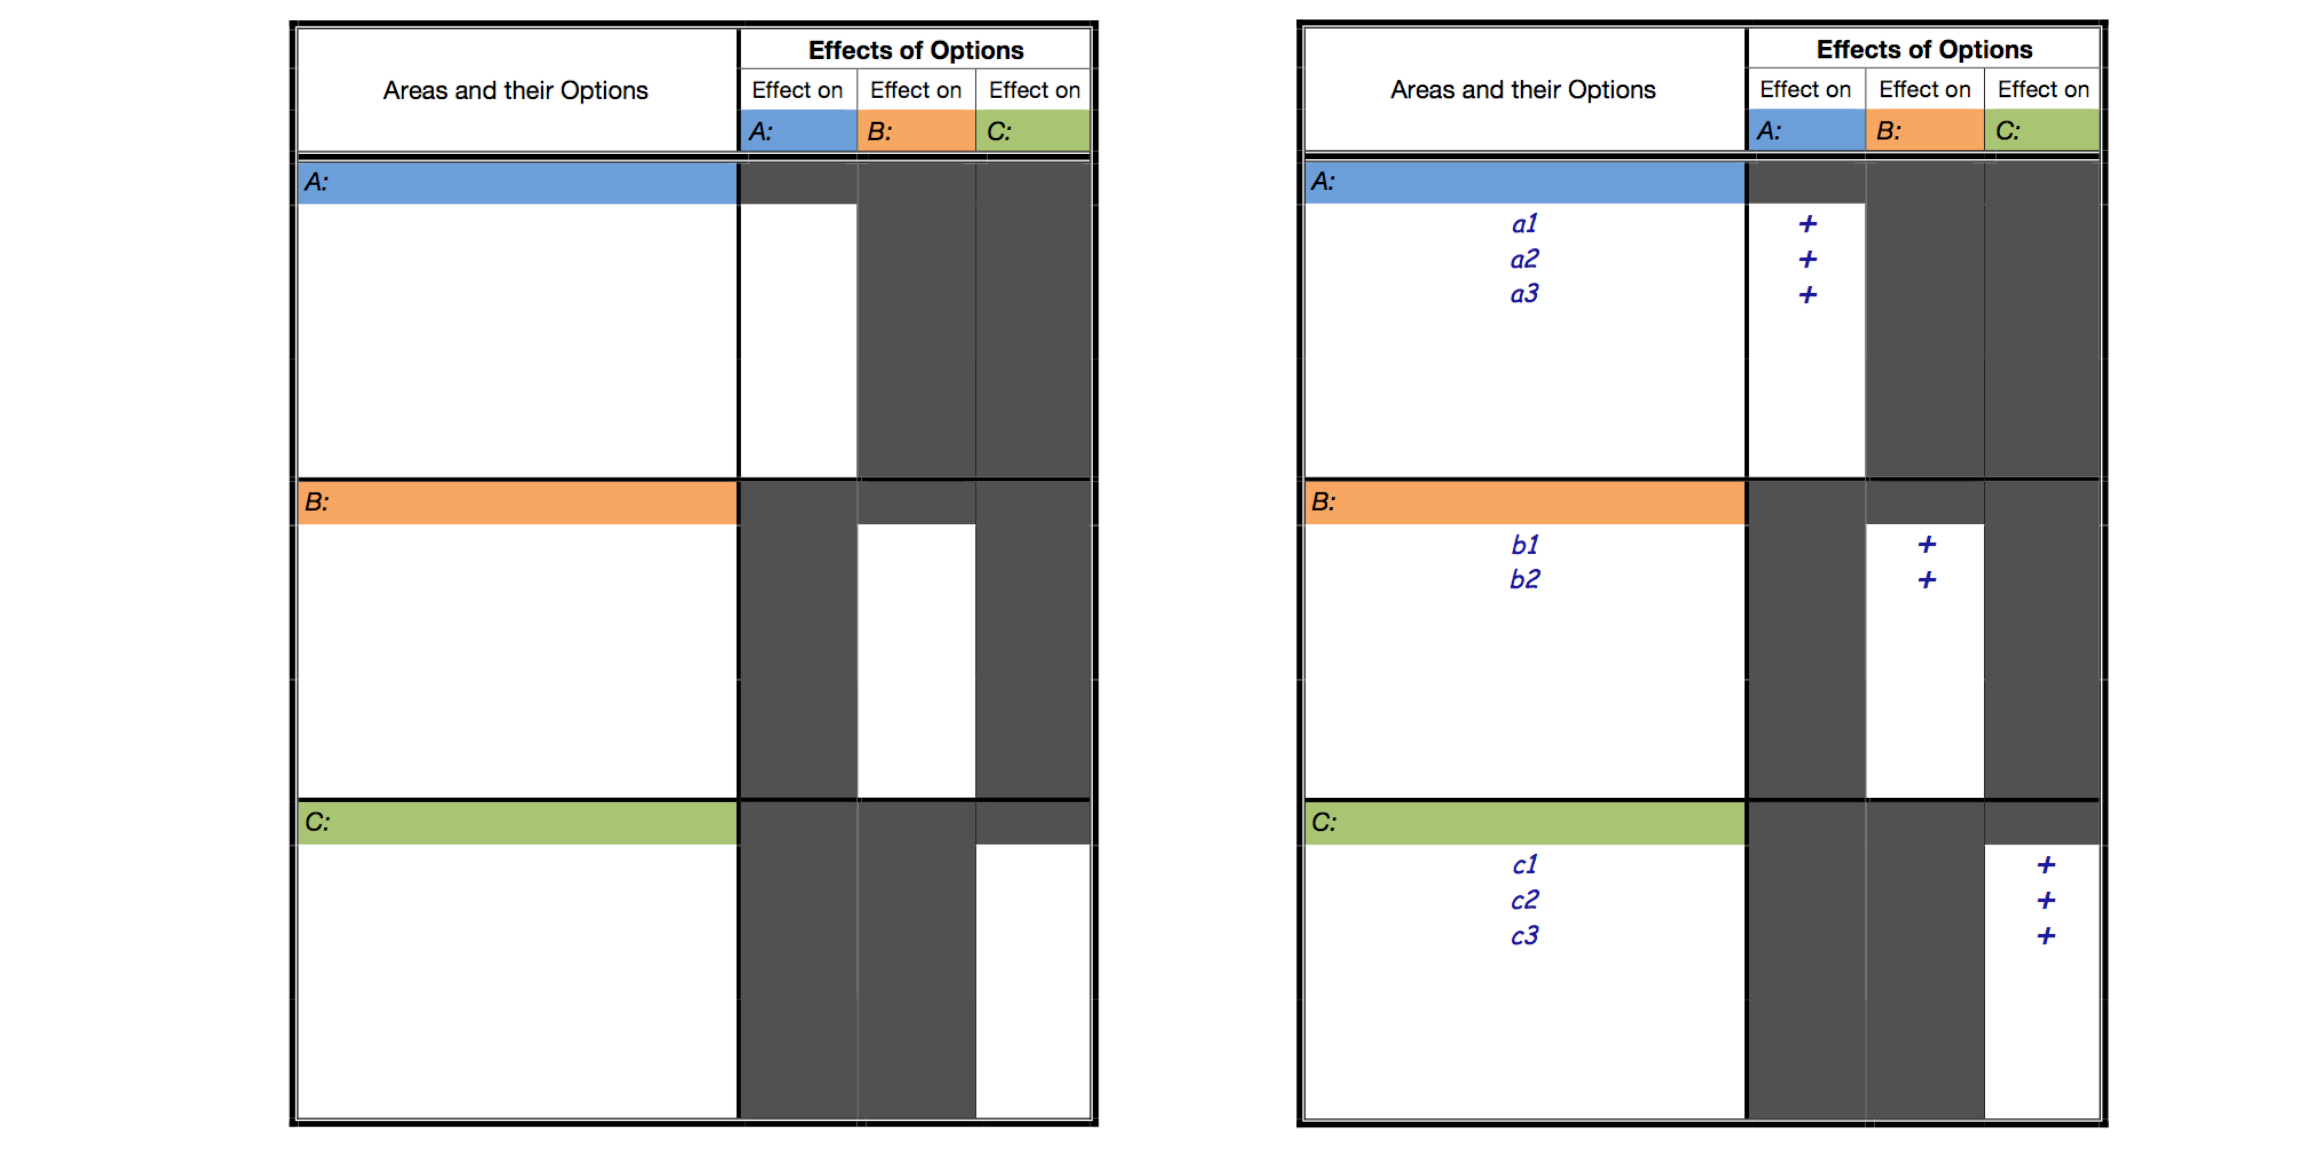
DemDim Figure 43 is simply a blank sheet, merely showing that this particular use of the exercise involves just three areas. So I haven’t wasted space here by including a version of that blank sheet. The first table to be provided here, Table One (see the next page), is essentially the same as DemDim Figure 44. In the Major Activity you will be using full-page versions of these tables. During this introduction I shall use small
versions, and will show you each table both before it is filled in (on the left) and then after it is filled in using the details in the DemDim exercise, as you can see with Table One below.
As mentioned on page 3, in the Outline of Today’s Work, the tables used in the Major Activity are reproduced on pages 29–33, in the Major Activity. Also, on pages 34–38, also in the Major Activity I have included an amended version of the tables for considering four areas rather than just three. If you only have time to go through the Major Activity just once then, for simplicity, I imagine you would prefer to stick to a three-areas case: therefore that is the version of the tables included within the text of the Major Activity.
Here then is Table One, firstly as you will find it in the Major Activity (apart from being about one-fifth of its size!) and then secondly corresponding to the details in the DemDim exercise. (Now is the time for you to recall and act on the small-print paragraph at the bottom of page 10, above.)
Describe this table
Two side-by-side worksheets sharing the same layout: a tall left column Areas and their Options (rows grouped by Area A in blue, Area B in orange, Area C in green) and three narrow columns on the right under Effects of Options (Effect on A, Effect on B, Effect on C). The grid has greyed-out cells that block off “off-diagonal” judgements — at this first phase each area is only allowed to record the effect of its own options on itself. The left worksheet is blank, ready to fill in. The right worksheet is the worked DemDim example: Area A has adopted three options (a1, a2, a3), Area B two (b1, b2), Area C three (c1, c2, c3) — eight options in total — each marked with a single + in its own area’s column and nothing else. Subsequent tables in this chapter (Tables Two through Five) reprise the same blank-vs-filled side-by-side layout for later phases of the exercise; only their row content and which cells are open or greyed changes.
TABLE ONE
So, as in DemDim, three options are adopted in both Areas A and C, and two options in Area B. Otherwise Table One simply shows that all eight options are advantageous (+) to the area that chose to adopt them—which, of course, is the sole interest in the first (“darkness”) phase.
The left-hand column in these tables is relatively wide in order to leave room for you to describe the options that you choose during the Major Activity. Here the options are simply denoted by a1, a2 and a3 for Area A’s options, b1 and b2 for Area B’s options, and so on. Notice that this is a change in notation from that used in DemDim: there the options were just denoted by i, ii, etc. The reason for this change is that a few people were misled by the previous notation, thinking that there must be some connection between, for example, the options labelled “i” in each of the three areas. There is no such connection, and so my new notation should hopefully prevent that confusion. The old notation was used not only in DemDim but also in The New Economics and also, to the best of my belief, by the originator of the exercise, Mr Fred Z Herr, who is acknowledged in footnotes on DemDim page 232 and The New Economics page 58[83].
In order to bring this particular exercise rather “closer to home”, you might like to look ahead to your own application of the exercise now by deciding which three areas of your own organisation you would like to include. You should surely choose the section or department of the organisation to which you belong or with which you are most involved. Then think carefully about which other two areas to include, areas with which your area interacts, or on which it depends, etc. Perhaps you could consider both a “supplier” area and a “consumer” area, i.e. the former being one on whom your area is affected by the quality, quantity, reliability etc of what it does, and the latter an area which is affected by the quality, quantity, reliability etc of what your area does. For your reference later on, write down here your own section or department as Area A and the other two areas as Areas B and C.
Table Two below reflects the beginning of the second phase in which the effects of the options on all three areas are now brought into consideration. (On DemDim pages 235–236 this change to Table Two is spread over Figures 45 and 46.) An extra column is added on the right and an extra row along the bottom in order to add up the + and − signs in the table as in the DemDim example. In this basic version of the exercise, the judgment is simply made in each case as to whether the option is advantageous (+) or disadvantageous (−) to the relevant area. This is where the basic version is relatively crude, and I shall suggest you consider a wider range of possibilities when you get into the Major Activity.
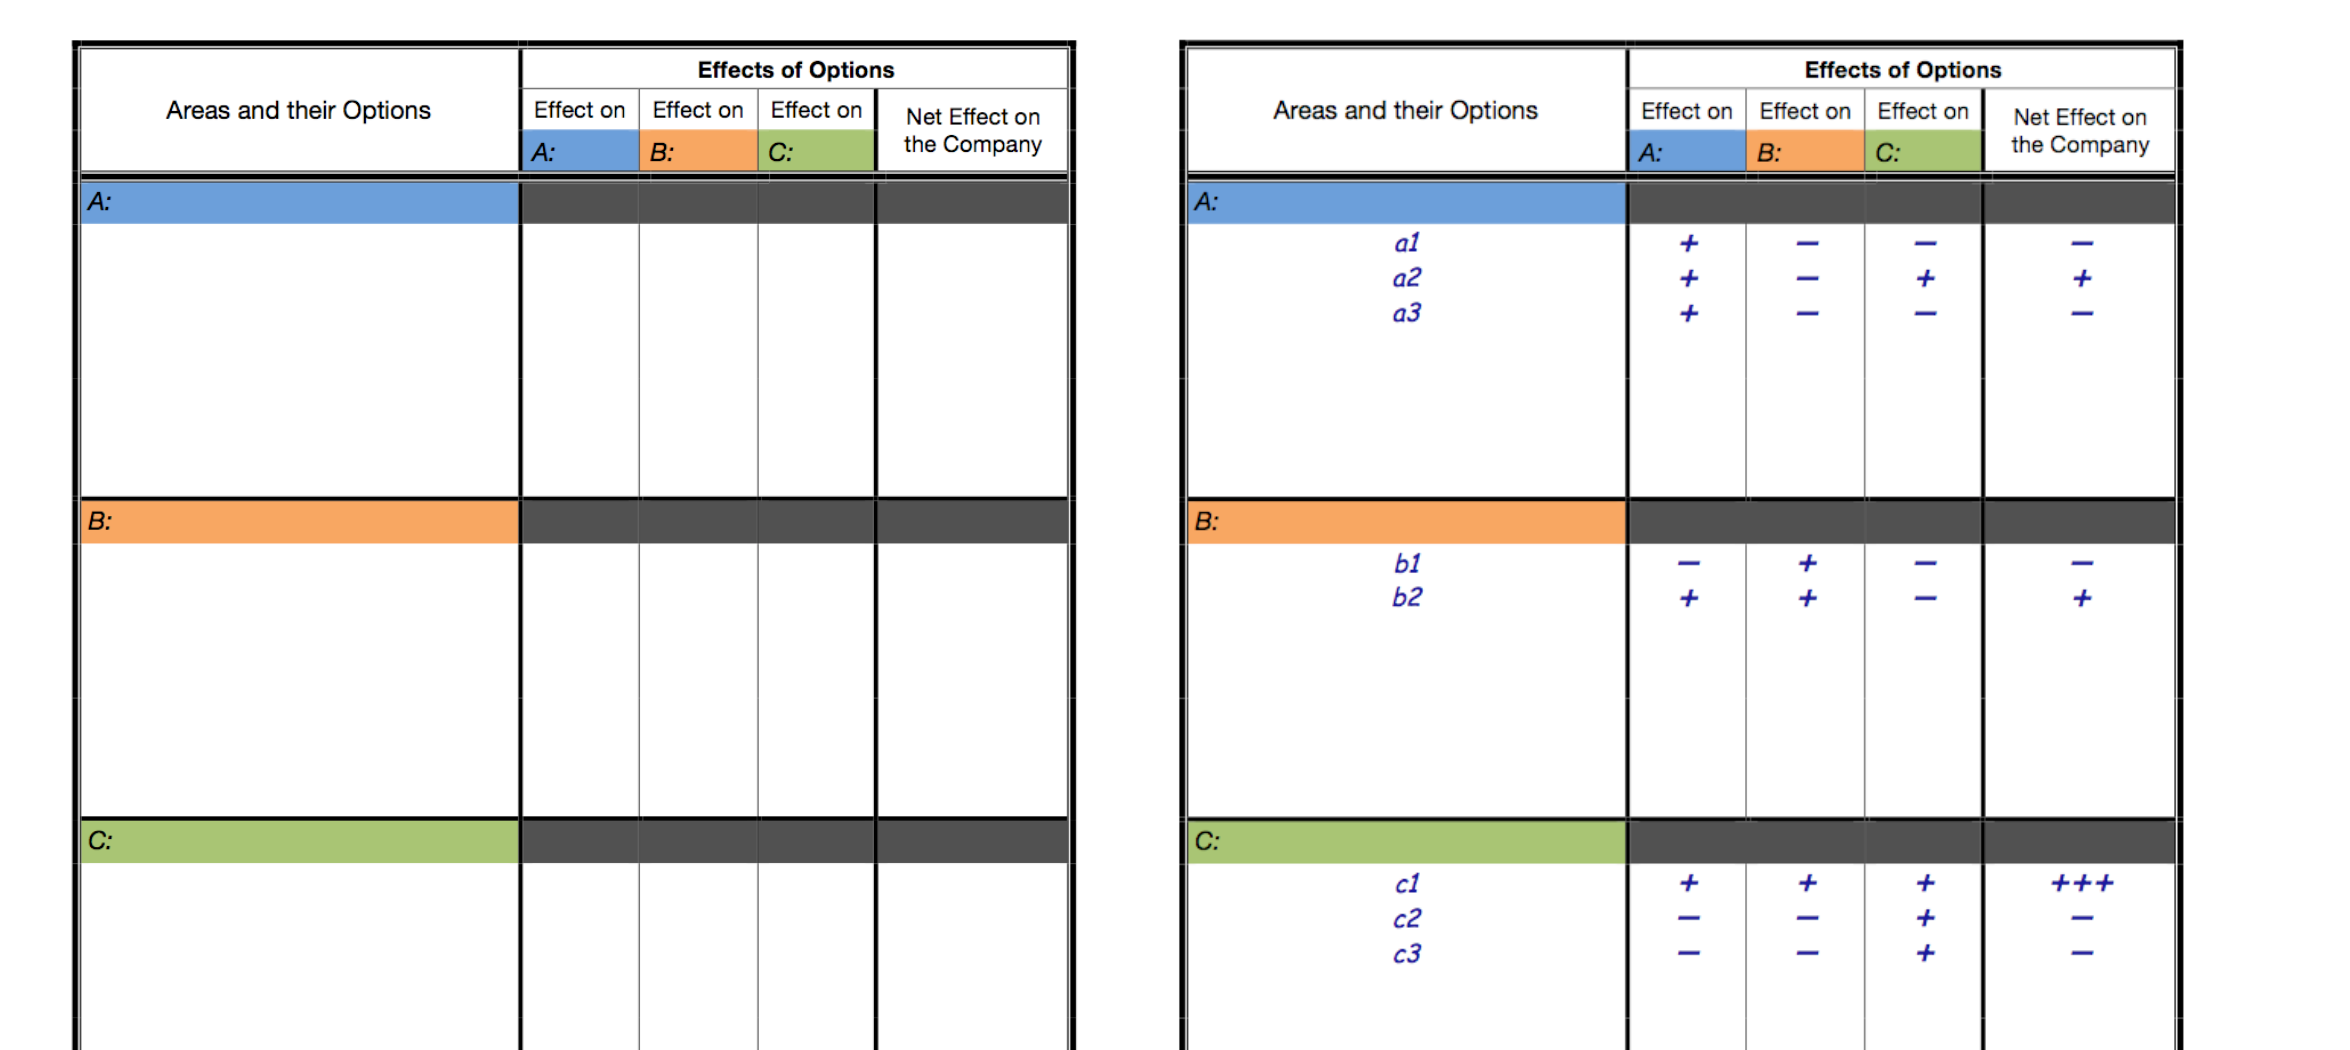
TABLE TWO
The conclusion from this basic version of the exercise is that, since there happen to be an equal number of + signs and − signs in Table Two, all that work of adopting those eight options would be to no avail: there would be no overall gain (or loss) for the organisation! Instead, of course, the sensible thing to do is to only adopt those options which produce overall gain, and that gives us Table Three which follows. (Table Three is equivalent to DemDim Figure 47; the only difference is that Table Three includes only the options which produce an overall advantage, i.e. have + signs in the “Net Effect on the Company” column, whereas in DemDim Figure 47 the other five options are still visible but are now shaded over in order to indicate that they will not be adopted in this second phase.)
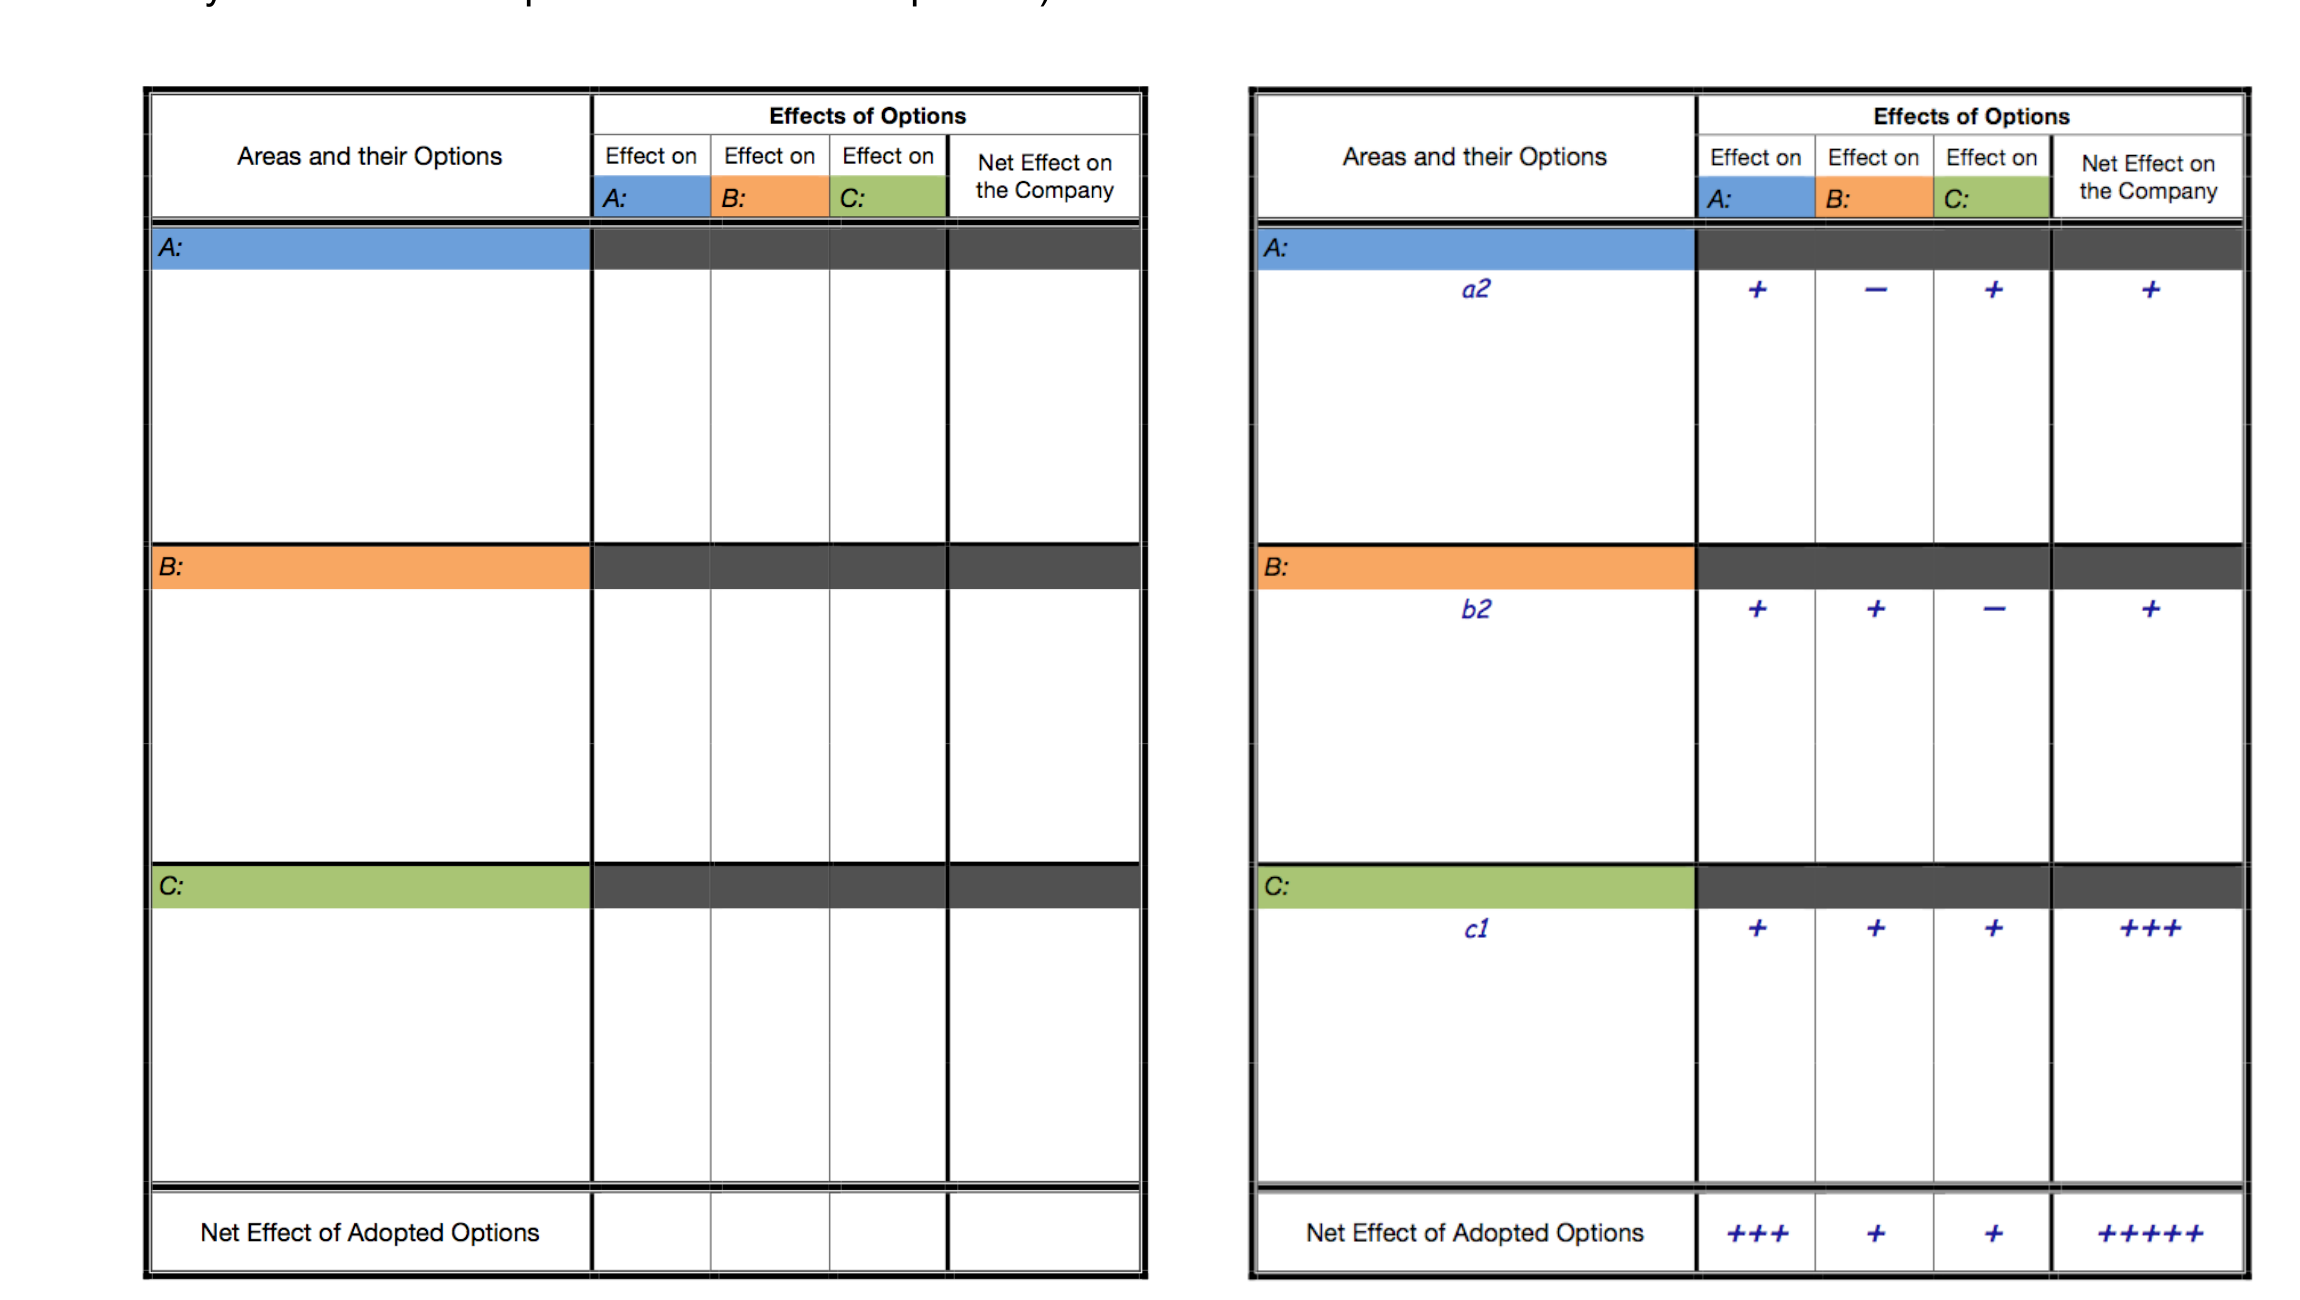
TABLE THREE
Then we move on to the third phase: the really solid understanding of the organisation as a system, Cooperation: Win-Win, “All One Team”, etc. The whole emphasis is now on what is best for the system rather than what appears to be best for my department, my section, etc. A quotation from Deming which you will see on Day 10 page 11 expresses it well: “The performance of any component [of the system, thus including individuals, groups, departments and thus what we are referring to here as ”areas”] is to be judged in terms of its contribution to the aim of the system, not for its individual production or profit, nor for any other competitive measure.” Think about it! Really, what could be more sensible? When we reach that statement on Day 10, I shall remind you to think back to what you will have learned from today’s Major Activity.
In terms of this exercise therefore, the third phase implies that e.g. Area A will now begin to consider options that are actually disadvantageous to themselves in the sense of, say, extra work, cost, inconvenience, etc, as long as they are of real benefit elsewhere in the organisation, i.e. to both Areas B and C. The implication is (see Table Four on the next page) that such an option will have a − sign in Area A’s own column but will still be adopted if it warrants a + in the other areas.
Now, you may have some concern that this criterion is too simple! Yes, I agree. For example, if an option involves considerable expense etc to Area A but is of only minor benefit to Areas B and C then clearly it would not be worth adopting. As I have already indicated, for your own use of this exercise in the Major Activity I shall suggest refinements that will enable you to take such considerations into account. But, before that, let’s complete this current basic demonstration of the exercise. There is not much left to do.
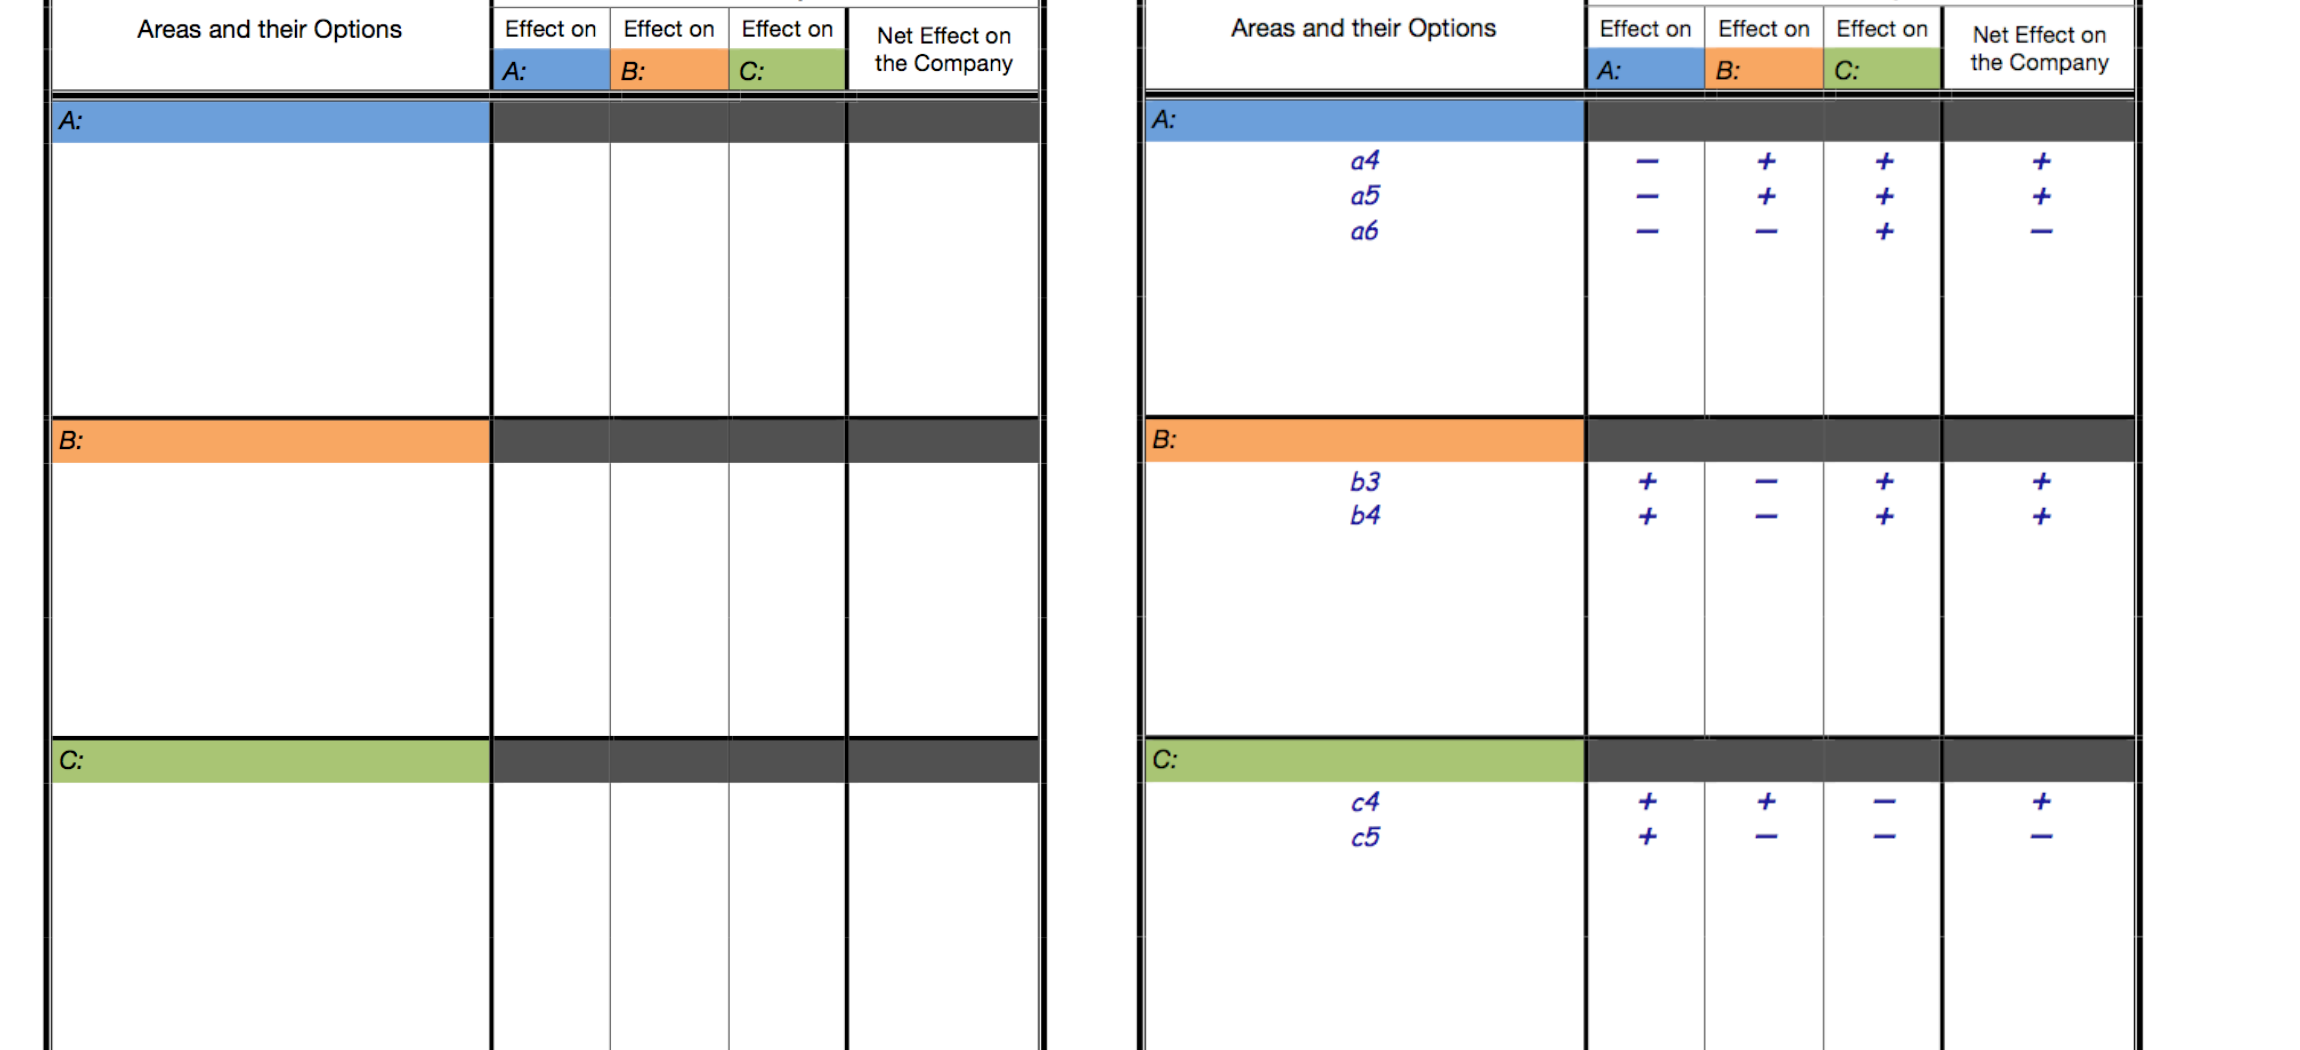
TABLE FOUR
In Table Four we see that there were altogether seven such new options under consideration; all of these therefore had a − in the area which was able to adopt it. In five of these cases, both of the other areas showed a +, indicating that the option would be of benefit to them. Therefore, in terms of the simple criterion in this basic version of the exercise, these five options would all be adopted, joining the other three shown in Table Three, thus producing the eight adopted options seen in Table Five at the top of the next page. This happens to be the same number of options as were being adopted in Table One, but just look at the difference in the Net Effect on the organisation. The eight options adopted in the first phase produced a zero Net Effect—loads of work but for no overall benefit to the organisation! Instead, the eight options that have now been much more wisely chosen in the third phase produce a heap of + signs as the Net Effect. Naturally, the latter is the same result as is shown in DemDim Figure 48 (page 238). (The only difference is that all the non-adopted options are still visible but have been shaded over whereas the adopted options are in the clear!)
The Major Activity begins on page 18, next. So, as promised, let’s now think about making this type of analysis more flexible and realistic. As previously mentioned, the main drawback of the basic scheme used so far is its limited manner of indicating the goodness or badness of the various options from the different viewpoints. Firstly, it can of course sometimes happen that an option which might be adopted by one area may have little or no effect on one or more of the other areas. So to force a + or − decision in such cases is rather silly. Thus let’s now introduce the possibility of simply stating 0 instead of a + or − in such a case. Secondly, to only have a single + or − available to indicate whether an option is appealing or unappealing is surely also too limited. From the viewpoint of the area considering adopting an option, that option might at one extreme be merely desirable or, on the other hand, could be considered as almost essential. Similarly, from the viewpoint of the other areas, an option can obviously have different levels of either desirability or undesirability. My suggestion here is therefore for the single + or − to now merely represent relatively moderate levels of favour or disfavour respectively, while we now expand the range to include + + + for extremely desirable and − − − for extremely undesirable, and then + + or − − for somewhere between “moderate” and “extreme”. I’ll presume you will adopt this more realistic scheme during the Major Activity.
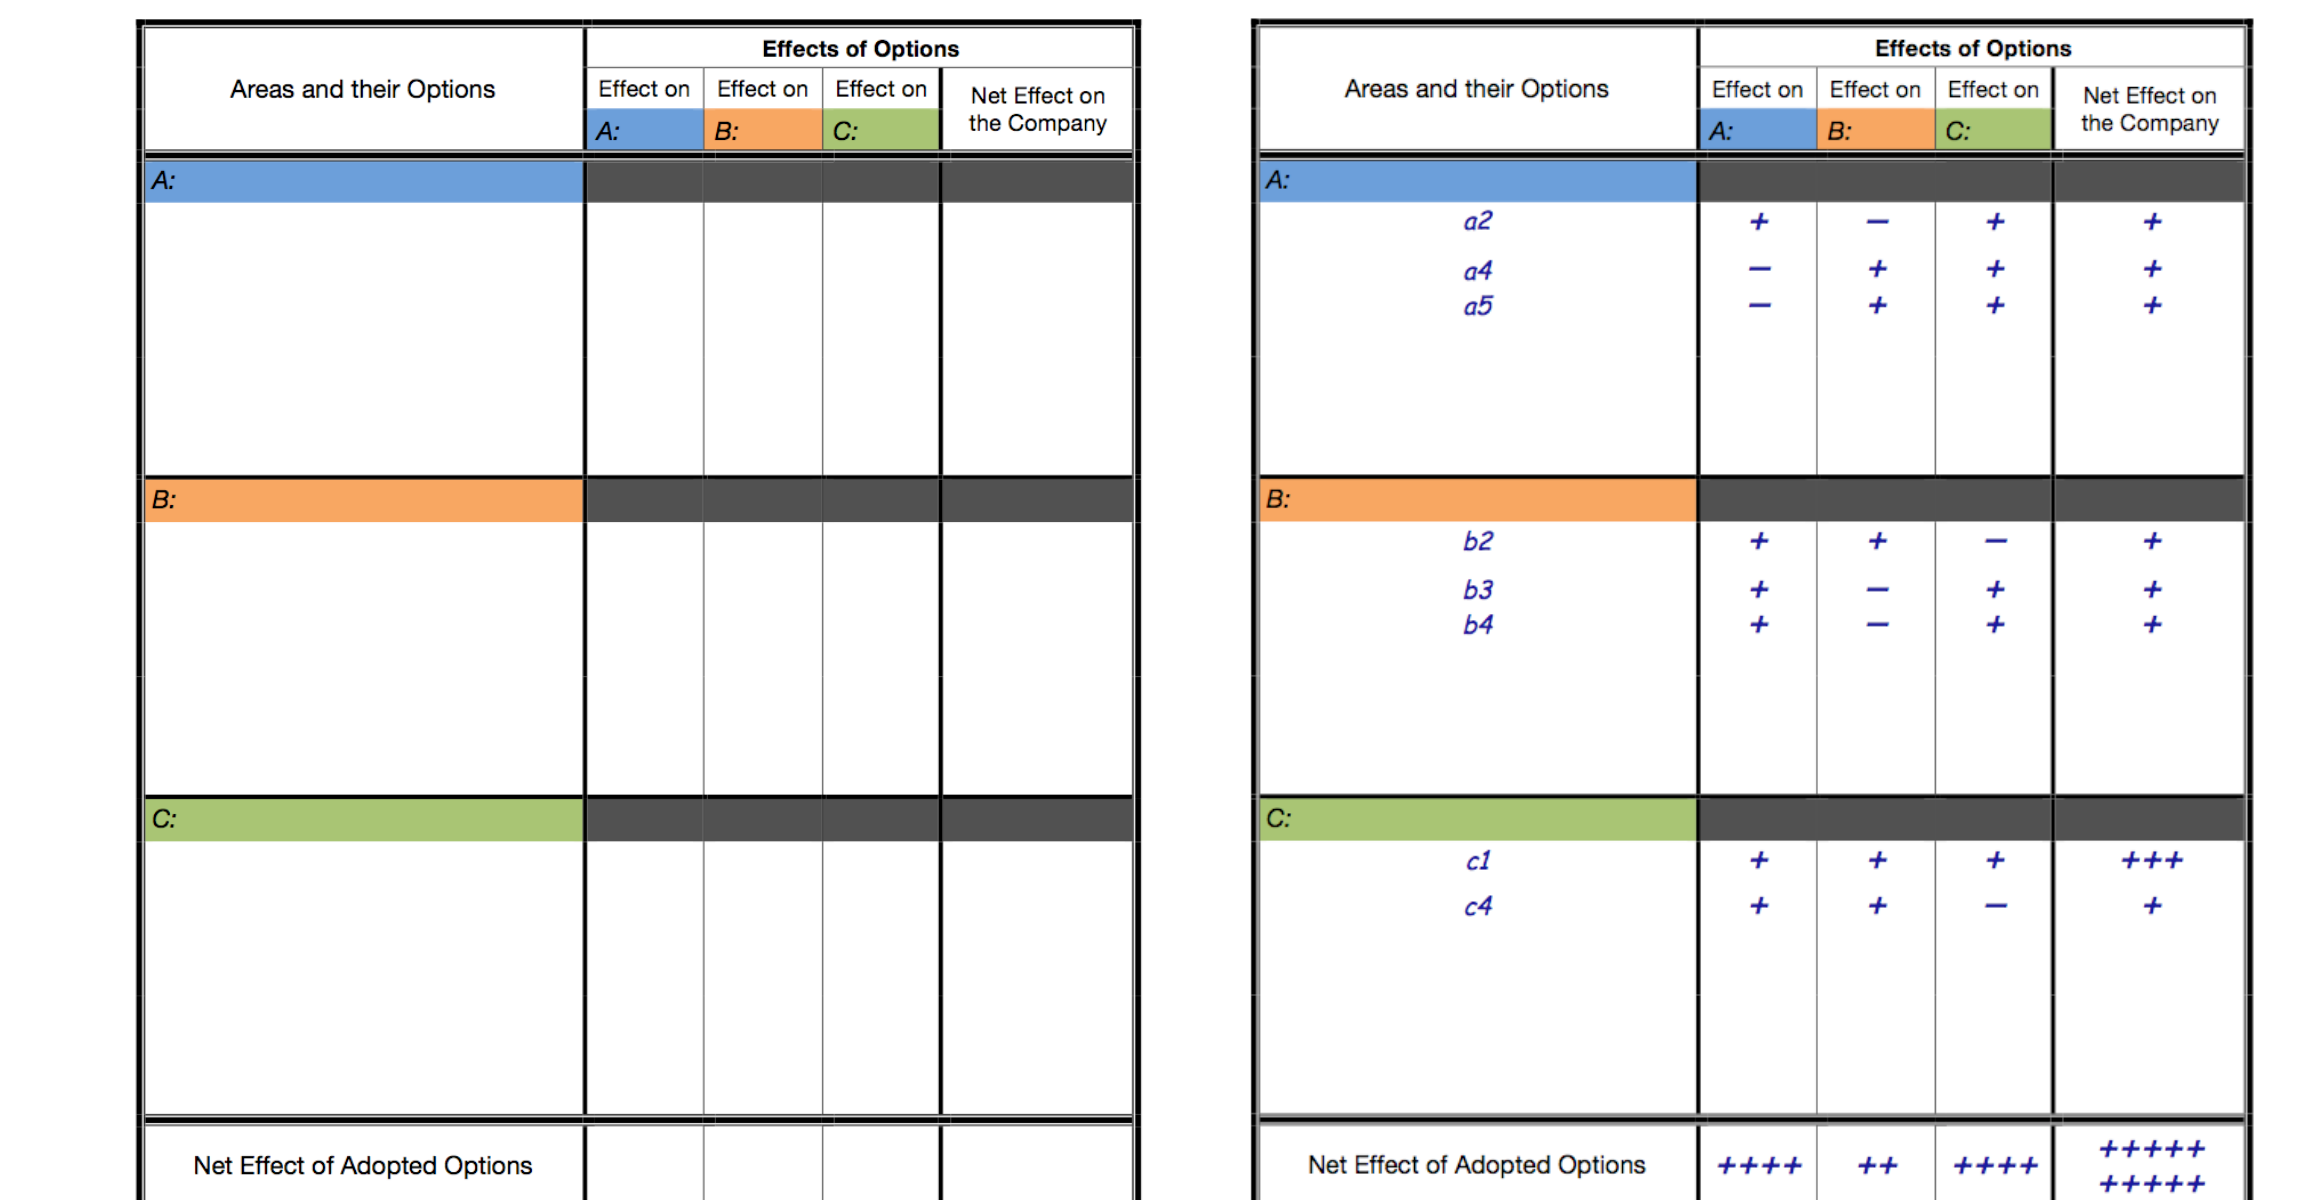
TABLE FIVE
Finally, there is a very important practical consideration to confirm and emphasise. What sort of things should be considered when allocating these “grades”—whether we are using the over-simple single + or − grades or the greater variety that I have just recommended? If you take a look back at the details as they were developed in Tables One and Two and then the additional ones in Table Four, the answer immediately becomes clear. The grades have been allocated according to “Old Climate” judgments, which could be summarised as “self-interest” for each area. Would this option be good for us here in this area in terms of less cost, less hard work, more convenience? If so, it’s on the + side. If it’s bad for us here in terms of greater cost, more hard work, more inconvenience, then it’s on the − side. End of story! So, during this exercise, “Old Climate” judgments are always made, i.e. irrespective of the option’s effects elsewhere. I’ll discuss this matter further later in the Major Activity, on page 28.
If you are reading a printout of what follows, or alternatively have a two-page display on-screen, you will see that full-size Tables One to Five are on the right-hand pages while the left-hand pages contain guidance presented as a series of steps. Also, as a reminder, on the left-hand pages I am also reproducing the reduced-size tables we have just seen while developing the DemDim example. Apart from using the wider choice of “grades” just introduced, your progress through the Major Activity should be the same as in the demonstration that we have just been through, though I’ll give a little extra practical guidance where necessary. As mentioned on page 3, in the Outline of Today’s Work, if you are working on your own then you may well have time to work through this Activity more than once, e.g. once or twice with three areas and then once with four areas. If you are working in a group then it may be that the discussions which arise will mean you only have time to go through the Activity just once—but that would not necessarily be bad since the discussions could prove to be extremely valuable. However, in view of these various possibilities, there are no clock icons during the Major Activity.