SOME RECOLLECTIONS
~ 11 min reading · ~ 105 min at Neave’s pace (~ 90 min on Stats-level 0)
In spite of the “stupidly simple” nature of the Red Beads Experiment, and in spite of our naturally having the All-Knowing’s perspective on it, emotions can run high. I shall not forget an occasion when, as soon as the experiment had ended, one of my delegates stood up, ashen-faced and with unsteady voice, to confirm that so much of what had just happened, so much of what I (as the Foreman) had said to the workers, so much of the way I had mistreated and abused them, eventually firing some of them for no justifiable reason, had not only all happened to him but to others in his family.
Another memory is from February 1992: the occasion when I took Tony Carter, recently appointed to the position of Secretary General in the British Deming Association, to meet Dr Deming and attend a four-day seminar in Miami. His hand shot up when it was time for volunteers to participate in the Red Beads Experiment, and he became one of the Willing Workers. Imagine how he felt—on stage with Dr Deming in front of some 600 Americans as the new organisational and administrative head of the BDA. Of course he wanted to do well. Of course he tried hard to follow instructions. But his performance, as measured by his results, was abysmal. In the subsequent issue of the BDA’s newsletter, he wrote:
“The time came to sack the worst three Willing Workers and, sadly, I was one of them. Even though I knew perfectly well it was entirely the result of the system, I could not escape an illogical feeling of failure. The new Secretary General of the British Deming Association had been fired by Dr Deming at our first meeting!”
I know how he felt. I was there. I was willing him to do well. I think I finished up feeling as embarrassed as Tony did.
A further recollection comes from one of my seminars later that same year. A delegate pointed out that, had the supplied materials not been of such poor standard, the workers would not have produced so many defectives. I reminded the delegate that these were hard, competitive times. The contract for supply of beads had been put out to tender, and one particular supplier had come up with an exceptionally good price. It was so good that we couldn’t afford to turn down such a good bargain, even if maybe his product wasn’t quite so good as we could have obtained elsewhere. It was truly “an offer that we couldn’t refuse”. A second delegate immediately spoke up to confess that he had just used those exact same words back at his company the previous day.
Two particular runs of the Red Beads Experiment stick in my memory despite the fact that they both took place around 30 years ago. They were the experiments which produced the very best total score and the very worst total score that were obtained over approximately 150 experiments carried out with exactly the same Red Beads equipment as I used at the Ireland seminar.
If you were still in the Un-Knowing state, you would probably not be at all surprised to learn where these two sets of results originated. The very best score (a total of just 203 red beads) was obtained by the most elite set of workers I was ever privileged to have participating in the Red Beads Experiment: five departmental heads in the British Government’s Central Statistical Office plus one University Professor of Statistics. At the other extreme, the very worst score of 270 red beads was produced on the first of two occasions that I performed the experiment in Madrid, and some people might have doubts about the abilities of Spanish workers. Hold on—don’t take offence at that remark! The point of this suggestion—and yet a further important message that comes from the Red Beads Experiment—is how easy it is to find data that appear to provide “evidence” to support personal prejudices. Let’s take a look at both sets of data.
As with the experiment in Ireland described on pages 9–16, starting in A Brief Overview, a “performance appraisal” takes place at the end of the third week; the three “worst” workers are then fired and the “best” workers have to work double time during the fourth week—they will need to produce two paddles of 50 beads, not just one!
Here are the professional statisticians’ results:
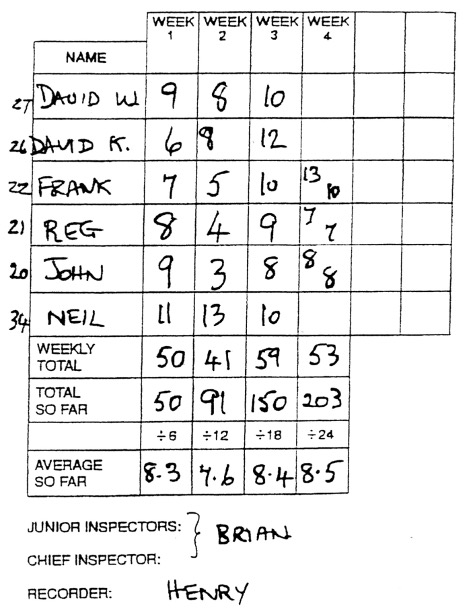
As you will quickly deduce, not only was this an unusually elite audience for a Red Beads Experiment—it was also my smallest! The audience consisted of just the six people I’ve already mentioned, who therefore were all “encouraged” to volunteer as Willing Workers! So, with no further personnel available, I acted as Recorder as well as Foreman. Further, the inspection process had to be carried out in this instance not by the usual team of three inspectors but just by my colleague Brian Read. I suppose I also acted as Chief Inspector, for I did check extremely carefully Brian’s counts of the red beads!
As always, there was plenty for the Foreman to talk about. David W. got off to a rather poor start—nearly twice the permitted quota of 5 red beads. But the second Willing Worker, the late Professor David Kerridge (a great friend and colleague), immediately got down to just one above the quota. However, now look at those steadily deteriorating results in the rest of that first week. Maybe they were slow learners and still didn’t quite understand the job. I therefore gave them a brief additional training session before the start of the second week—and observe the vast improvement that resulted (except, that is, for Neil who clearly never got the hang of it!).
So then came my announcement of the forthcoming performance appraisal and the fact that the worst three workers would be fired at the end of the third week. This frightened them so much that, mostly, they just couldn’t concentrate properly on the job during that third week. The worst performance of all came from Professor Kerridge—but perhaps he’d already decided to seek work elsewhere!
Moving on to the Spaniards below, you can be sure that, in particular, I had some pretty severe words for the “best workers” who so clearly betrayed the trust I had in them during the fourth week after I had fired the others. Just look at these appalling results!
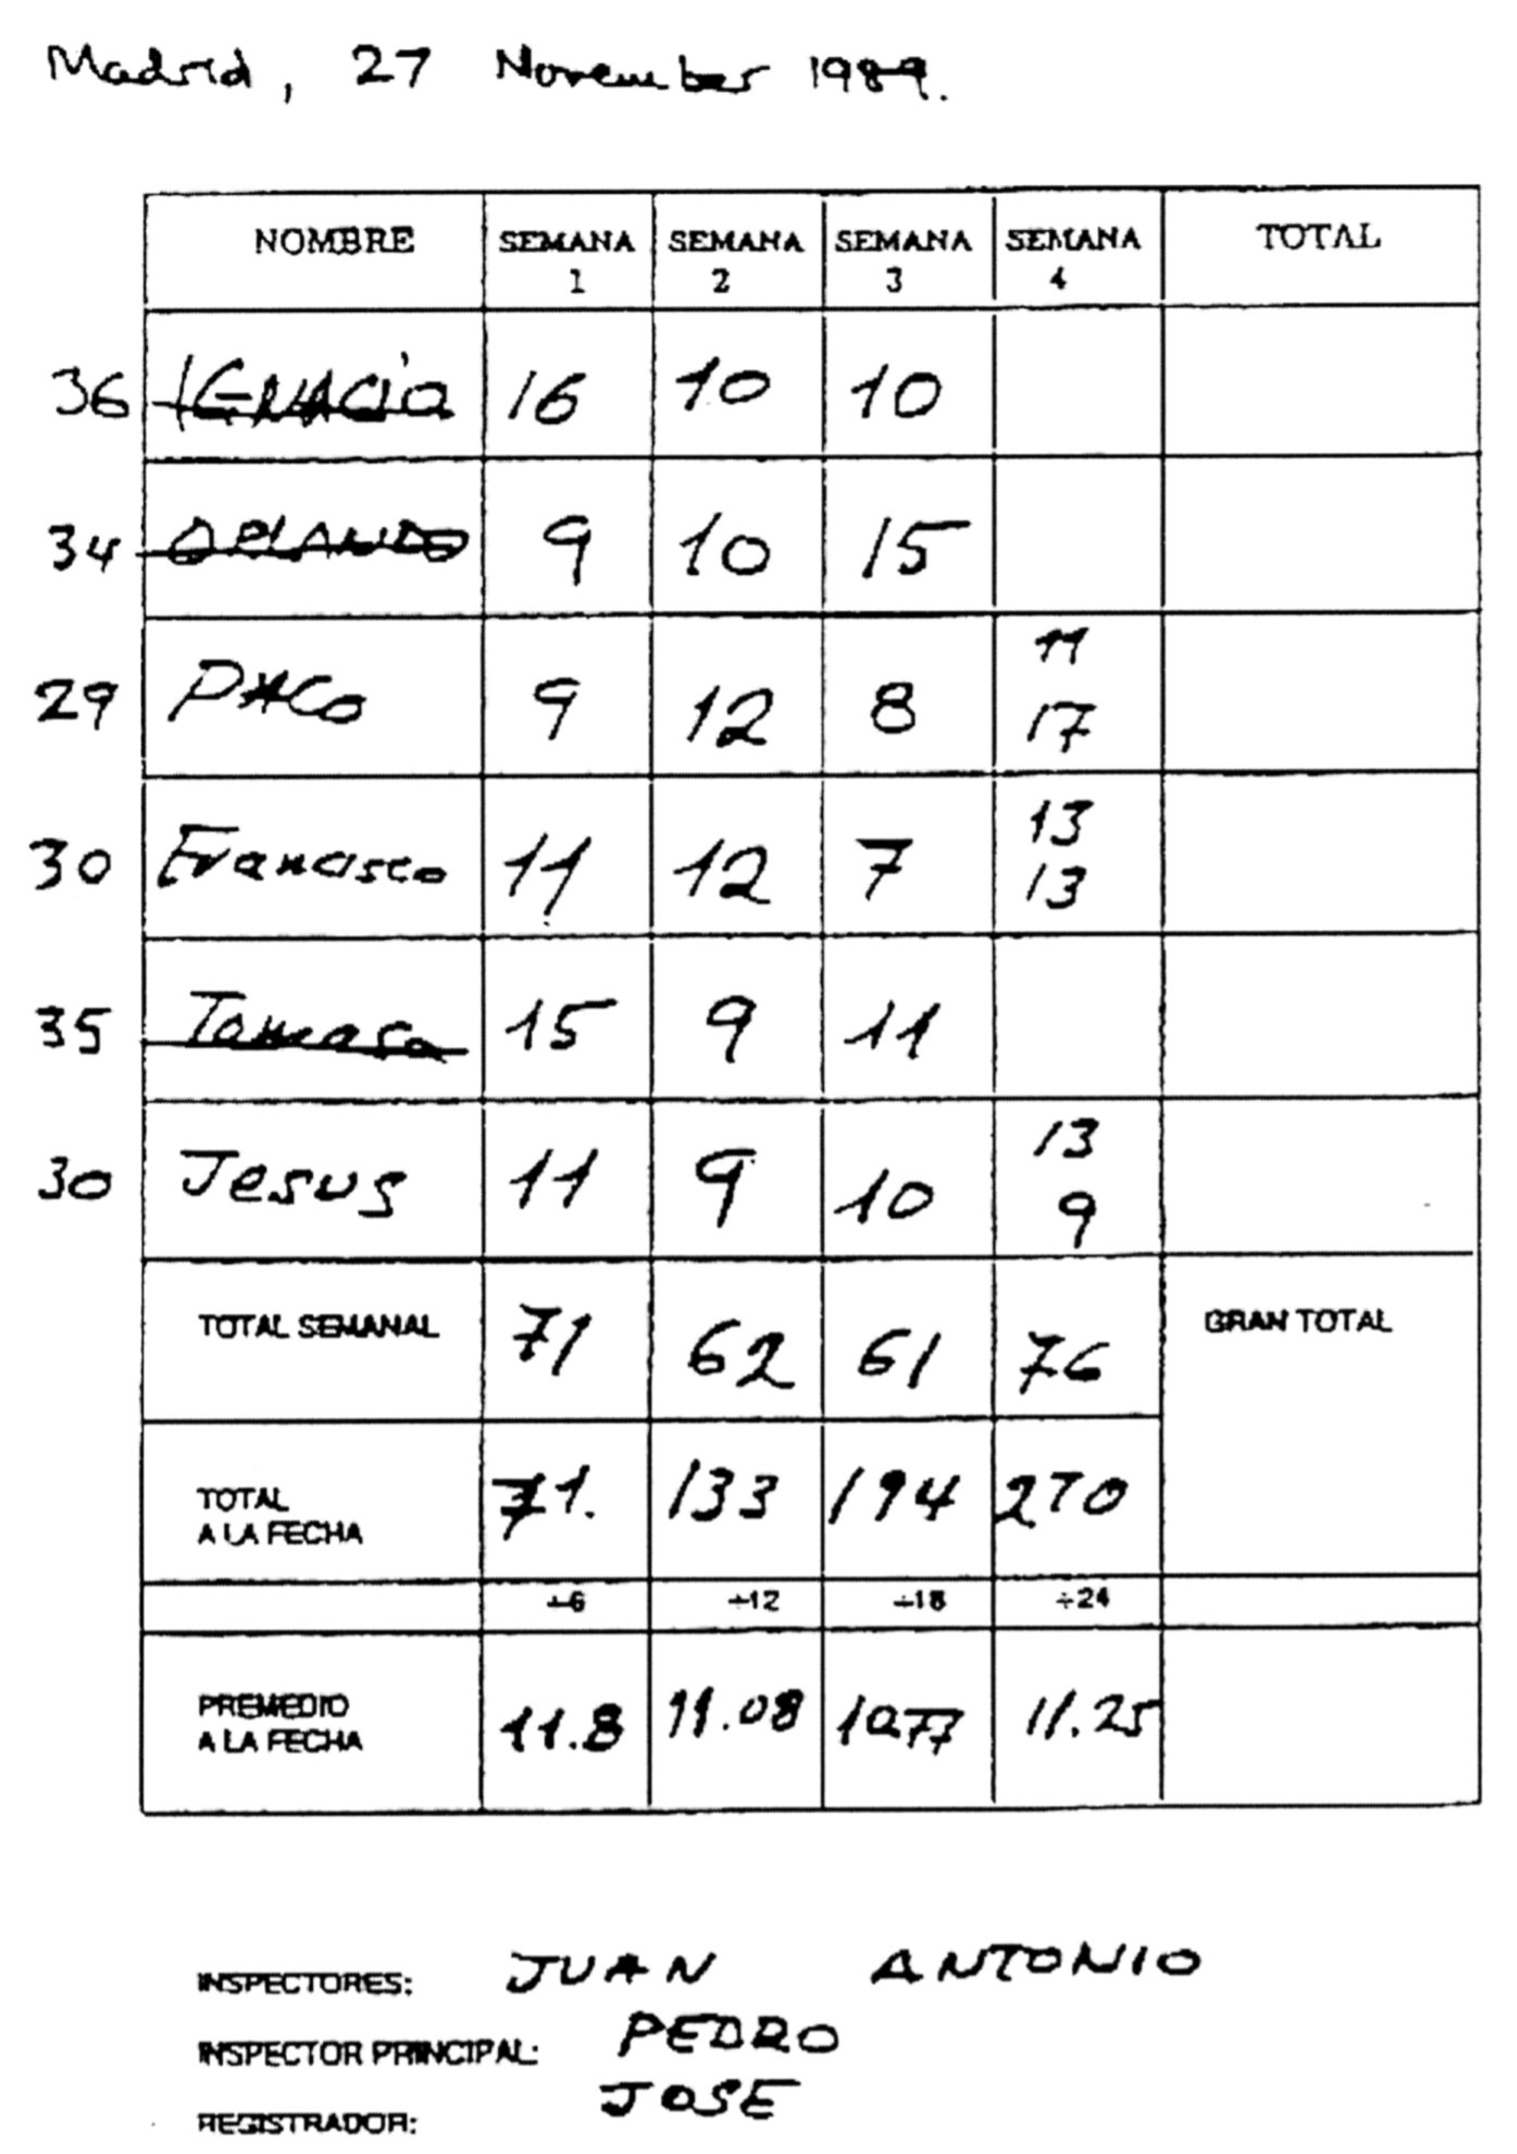
So now we have yet more of the profound messages which this “stupidly simple” experiment communicates. The emotions raised and havoc wreaked by treating common-cause variation as if it were special-cause variation is one. Then the ease with which one can invent reasons to “explain” random variation is another. Similarly, the ease with which we can find data that appear to confirm what we want to believe or what we want to persuade others about (however idiotic it is) is yet another.
Finally, regarding my recollections, here is a reminder of the one I mentioned on page 22, at the start of Your Turn: my understandable nervousness as I approached running the Red Beads Experiment in public for the very first time. I was to be faced with 24 as-yet-unknown random numbers of red beads and would have to comment upon each with little or no hesitation. Would I be able to think of anything to say?
Well, in Activity 2–f you’ve now had your own initial experience of the same situation, albeit without the pressure of performing in front of a paying audience. In my case, having muddled through that first time, I was nowhere near as nervous the second time; and still less the third time. In fact, I soon found that not only was I beginning to enjoy running the experiment but I was also discovering for myself more and more of those “profound messages” which the experiment can convey. Not only were my audiences learning more from the experiment: so was I.
It is with those experiences in mind that I’ll ask you to take on the role of Foreman twice more this afternoon: the two occasions that I’ve just introduced, first with the elite statisticians and then with the Spaniards in Madrid. Whilst showing you the data, I’ve already given you a few obvious suggestions about how to react, especially in the case of the professional statisticians. Both of these sets of data present considerable opportunities for the Foreman to be exceedingly eloquent!
There will then remain just two further items on today’s agenda. First comes the Major Activity of writing up your comprehensive summary of messages to be learned from the Experiment on Red Beads. So, in preparation for that, keep adding to your list of notes as you now work through the statisticians’ and the Spaniards’ experiments. Then finally, after the Major Activity, there will be a short Postscript to complete the day.
ACTIVITY 2–g
As you will see, I have reproduced for you below and on the next page the statisticians’ data week by week. There is space on the right of the data for your Foreman-like comments on every count of red beads. An advantage of your carrying out this Activity without an audience is that you can have a little time to consider each response rather than having to come up with it “off the top of your head”. But don’t take too long about it!
(No good looking in the Appendix for more hints—I’ve given you plenty of help already!)
Again recall that, in my version of the experiment, I fired the three “worst” workers after the third week, leaving the other three to work double time in the fourth week. So, checking the table below, the “best” workers, Frank, Reg and John, produced 13, 7 and 8 red beads respectively during their first shift in the fourth week, followed in turn by 10, 7 and 8 in their second shift.
Next, as I had to do when running the experiment for the statisticians, it’s time for you to multi-task! You now take over as the Recorder and draw a run chart of the data. If you need reminding about how to draw a run chart, check back with the run chart of Dec’s data on page 14, in Our First Control Chart. Also as on that page, so that you don’t have to keep looking back, here are the statisticians’ counts of red beads in time order:
Finally, insert the two control limits to turn the run chart into a control chart, and then state your conclusions. If you’re on Stats-level 0 then simply look up the control limits on Appendix page 8. If you are on Stats-level 1 or higher then compute them in the space below. (If you need reminding about the details, Technical Aid 1 is on page 20, in The Truth, The Whole Truth, And Nothing But.)
(You can check your computations in Technical Aid 4 on Appendix page 9. But try it yourself first!)
Now it’s time for you to resume the Foreman’s role. Here are the Spaniards’ very different data. So please work through them as you did with the statisticians’ data. (Remember that these are extracts from the completed version of Jose’s table; thus ignore the fact that the names Ignacio, Orlando and Tamasa are crossed out since, of course, that did not happen until the end of the third week.)
Finally, return to the Recorder’s task of drawing the run chart and then upgrade it to a control chart. Here are the Spaniards’ counts of red beads in time order:
As before, insert the two control limits to turn the run chart into a control chart and state your conclusions. Also as before, if you’re on Stats-level 0 then simply look up the control limits on Appendix page 8; otherwise compute them in the space below.
(Again the computations are sketched in Technical Aid 4 on Appendix page 9.)
Regarding conclusions from the control charts, they are surely similar to those for Pause for Thought 2–e (on Appendix page 7) except that this time we would presumably comment on statistician John’s 3 or Ignacio’s 16 and Paco’s 17 in similar ways to Ernie’s 3—they’re all within the control limits.
The Foreman’s Transcript
Here are your Foreman reactions across both runs — the statisticians’ and the Spaniards’ — set against the fact that every count is nothing more than common-cause variation.