
INTRODUCTION TO THE FUNNEL EXPERIMENT
~ 10 min reading
One more time. Dr Deming warned us that
“if we wade in at [problems] without understanding, we only make things worse. This is easy to prove.”
As with the Experiment on Red Beads, the Funnel Experiment may just look like a rather silly game when you are introduced to it. Hopefully, like the Red Beads Experiment, I think that before long you’ll realise it’s rather more than that.
As we know, the Funnel Experiment was created by Lloyd Nelson and subsequently described and discussed by Dr Deming in his four-day seminars. But, unlike the Red Beads Experiment, it was not actually carried out in the four-day seminars. There was a good reason for that. In the form suggested by Dr Nelson, it is only feasible to carry it out for real either individually or in small groups—not the several hundred at a four-day seminar! In that original form, you need:
- a funnel,
- a marble which is small enough to pass through the funnel,
- a table, exactly horizontal and covered by a thick tablecloth …
- … on which is marked a target-point—this is where (in our silly game!) we would ideally like the marble to come to rest after being dropped through the funnel and bouncing or rolling around on the tablecloth,
- a portable stand on which to fix the funnel at some convenient distance above the table and which can then easily be moved to different positions on the table,
- a ruler to measure how far the marble is off-target and a protractor to measure angles,
- … oh, and permission to record the resting-places of the marble on the tablecloth with a marker-pen!
Believe me—my version is easier to perform and also results in less laundry costs! Basically, it’s a one-dimensional version of the experiment, whereas the Funnel Experiment itself is two-dimensional. I.e., this is a “flattened” version of the Funnel Experiment where both the funnel and the marble can only move either to the left or to the right (one dimension) rather than anywhere horizontally (two dimensions) in the original version. A further advantage is that, unlike with the original version, we will now be able to analyse data produced in the experiment using tools we already know about: histograms, run charts and control charts. That would be, to put it mildly, rather more difficult with two-dimensional data!
There will be four strategies to examine during the Funnel Experiment. To save time I shall just ask you to construct histograms for the first two strategies and run charts for the other two. I shall return to the Funnel Experiment in Part A of the Optional Extras section where I will also show control charts in operation on data from the experiment.
So, in our one-dimensional version, imagine we have two tracks both like the following:
Describe this diagram
A horizontal track of 21 numbered squares, running from 20 on the left to 40 on the right. The middle square (30) is coloured differently from the others — that is the target-point for the silly game. In the imagined two-track set-up, the upper track holds the funnel (which can be suspended over any numbered square) and the lower track catches the marble (which finishes up displaced left or right of where it was dropped). On this single-track shorthand, both funnel and marble will be shown by little icons on the same row, as in the next diagram.
with one track suspended some distance directly above the other. (You will notice that the central number 30 is coloured differently from the others: 30 is the “target-point” in our silly game.) The funnel’s track is the higher one: it has a hole in the middle of each square so that the funnel can be suspended at any numbered position. The marble’s track is the lower one: the sides of the numbered squares are rigid but the insides of the squares are made of some elastic material. So the general set-up is that (a) the funnel can be placed at any position on the higher track and (b) the marble can then be dropped through it onto the lower track where it will briefly bounce around and then finish up in one of its squares—possibly directly under the funnel or, more usually, displaced by one or more squares to the left or right. To complete the image we should join the two sides of the top and bottom tracks by vertical sheets of glass or transparent plastic to prevent the marble bouncing off its track but so that we can still observe what’s happening!
However, you don’t have to build that whole model! During the description I shall show the positions of the funnel and marble along their tracks by little icons on a single track. So, for example, if the funnel is at position 31 and, after being dropped through the funnel, the marble bounces around and finishes up at position 33 then I shall show this as:

Describe this diagram
The same 20–40 track, now with two icons placed above it: the funnel sits above square 31, and the marble sits above square 33. This shorthand records a single drop — the funnel was placed at 31, the marble bounced and came to rest at 33 (two squares to the right of the funnel). Most diagrams in the experiment use this layout to record where the funnel was set and where the marble landed.
So how exactly will you be able to carry this out with your less extravagant set-up (of which details follow)?
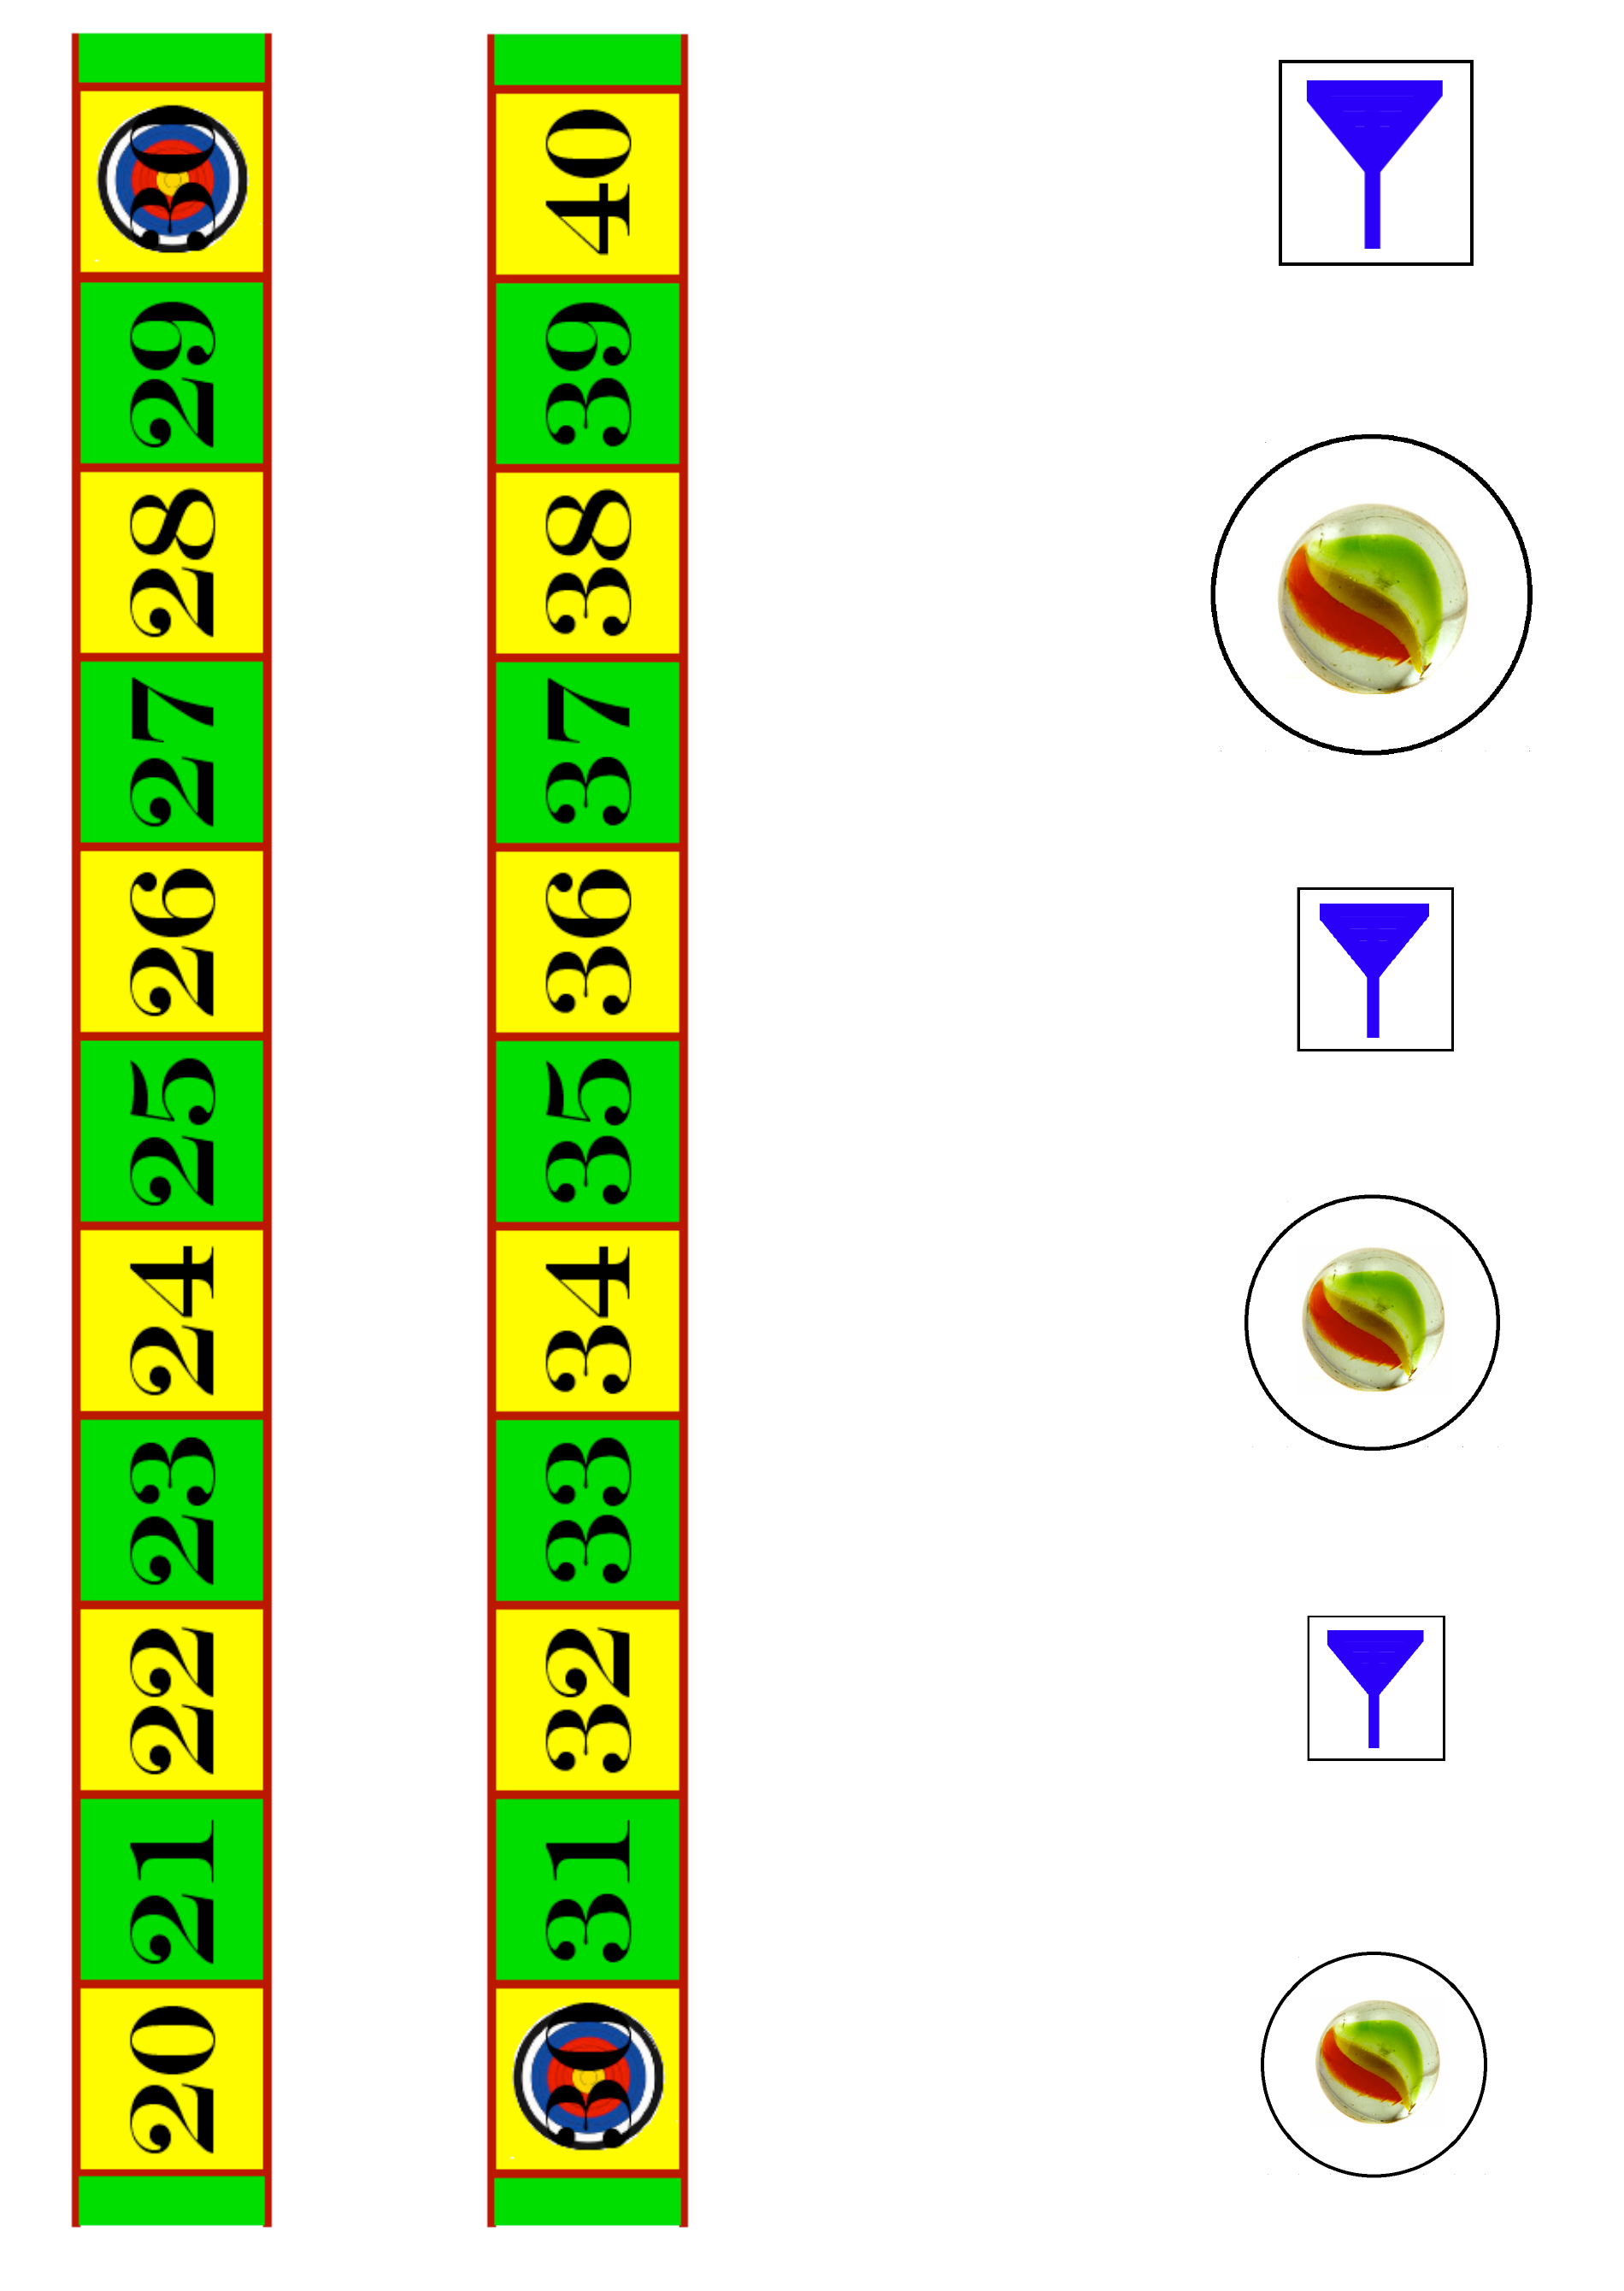
In our timing schedule we are now coming up to the lunchtime break. If you have not already done so, you will now need to prepare your own track like the one illustrated in order for you to be able to carry out our version of the Funnel Experiment, ready to use when we resume this afternoon. On page 59, below you will find a larger copy of the track in two parts, one part going from 20 to 30 and the other from 30 to 40. Preferably (but only if convenient) I suggest that you copy or paste these (either electronically or using glue!) onto some card. Then join them together into a single strip as shown above by attaching the two 30s one on top of the other. I’ve also included on page 59, below larger images of both the funnel and the marble: you could similarly put the image of each that you choose onto small pieces of card to use in the experiment. Alternatively, you could e.g. use a large silver coin to represent the funnel and a small copper/bronze coin to represent the marble.
Finally, as previously warned (on Day 2 page 44), you will also need two standard dice (and a shaker if you so wish!).
Then, fully equipped, you will be ready to carry out our version of the Funnel Experiment. When you begin, I recommend that you work through the first few pages of the Major Activity quite slowly and carefully since they will lay the foundations of how you will be spending most of the time this afternoon.
NB There will be no separation between Stats-level 0 and Stats-levels 1–3 this afternoon, and so then the timing guidance will only be included on the right-hand side rather than on both sides as during this morning.
If you are particularly numerically inclined, you could conceivably carry out this experiment without using the track: you might instead be able to visualise what is happening on the track by just interpreting the numbers which will develop. However, I believe most people will find it easier to actually see what is going on, at least in the early stages of operating the various strategies to be studied during the experiment.
But once you have become familiar with any particular strategy then you may soon find you can carry on without continuing to use the track. Use it for as long as you personally find it useful to do so and then, if you prefer, don’t bother with it any more. However, since I have worked through this entire Major Activity many times, you may find my own experience to be useful here. I soon found that it was definitely safer to use my track throughout every stage of the first strategy, since it is actually the trickiest of the four to carry out. I also worked with the track throughout the third strategy before realising that there was a useful and simple short-cut (which I’ll show you). I used the track for a little while with the fourth strategy but soon found that I didn’t need it any more. The second strategy is the simplest of all, and there I hardly needed the track at all. I shall reflect the relative ease or difficulty of the various strategies in my timing guidance.
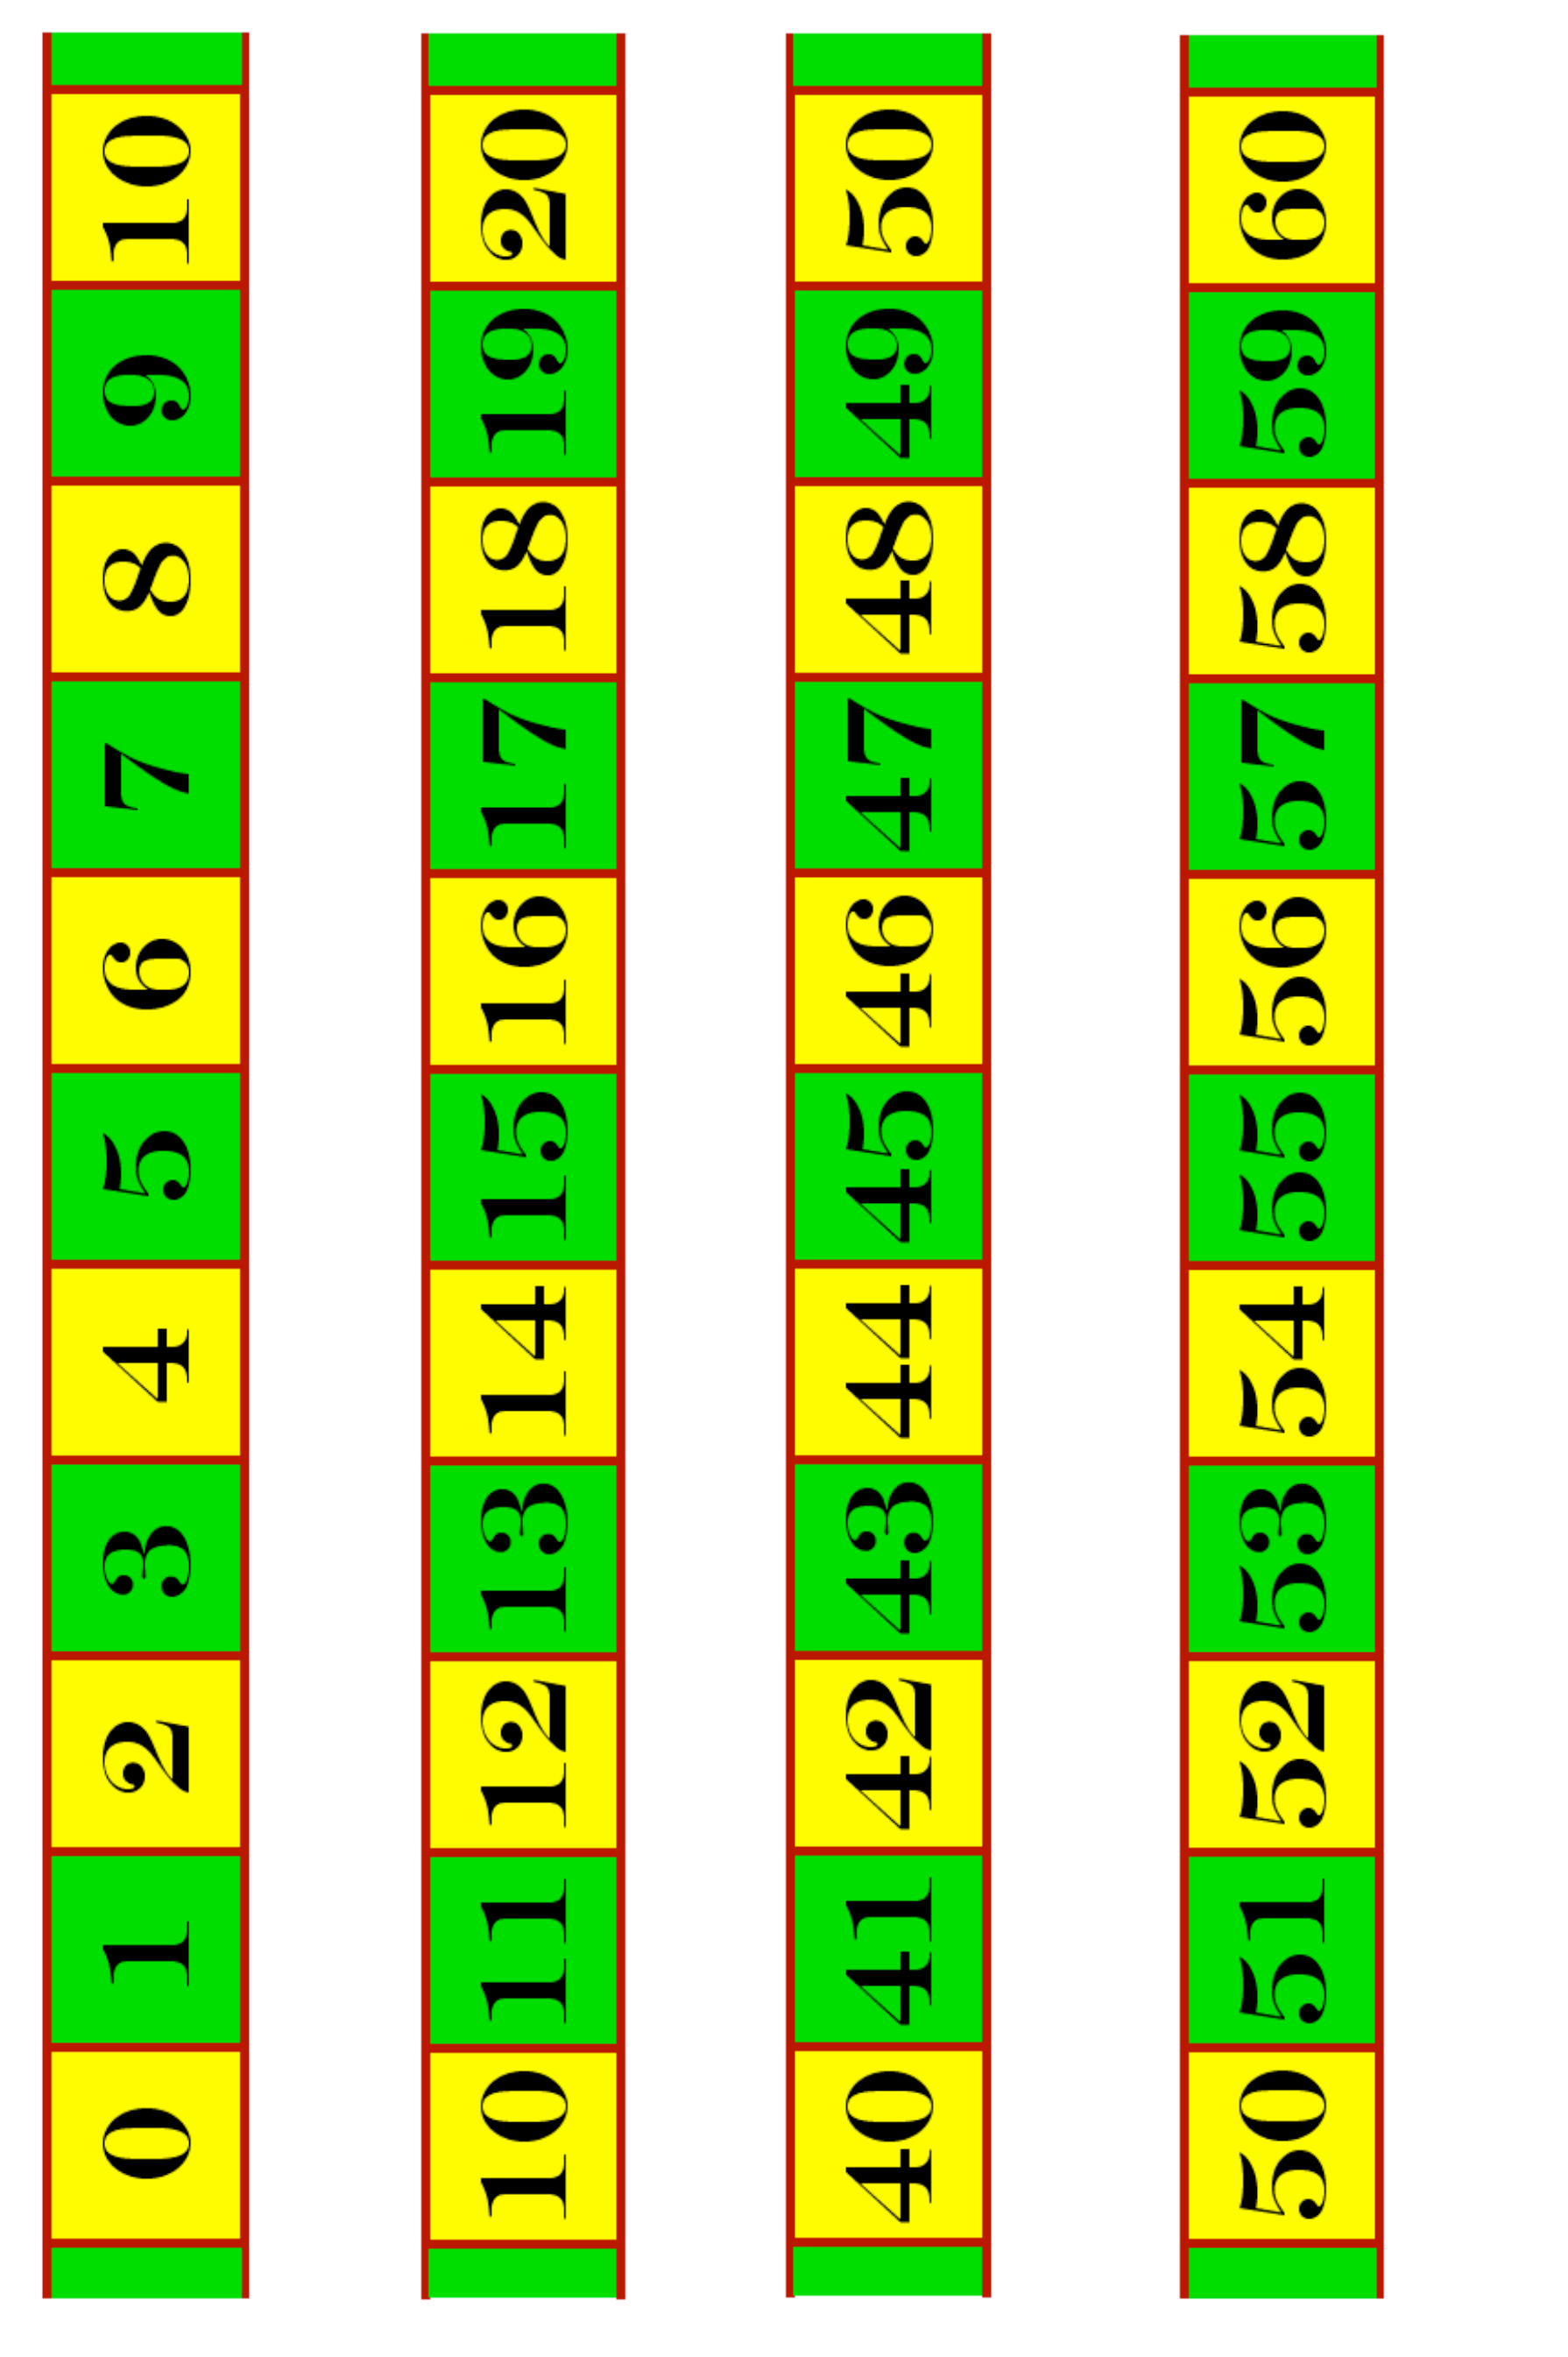
Your version of the track going from 20 to 40 will be sufficient for much of the afternoon. However, especially later on, you may occasionally need extensions outside that range. If so then you will find them on page 61, below.
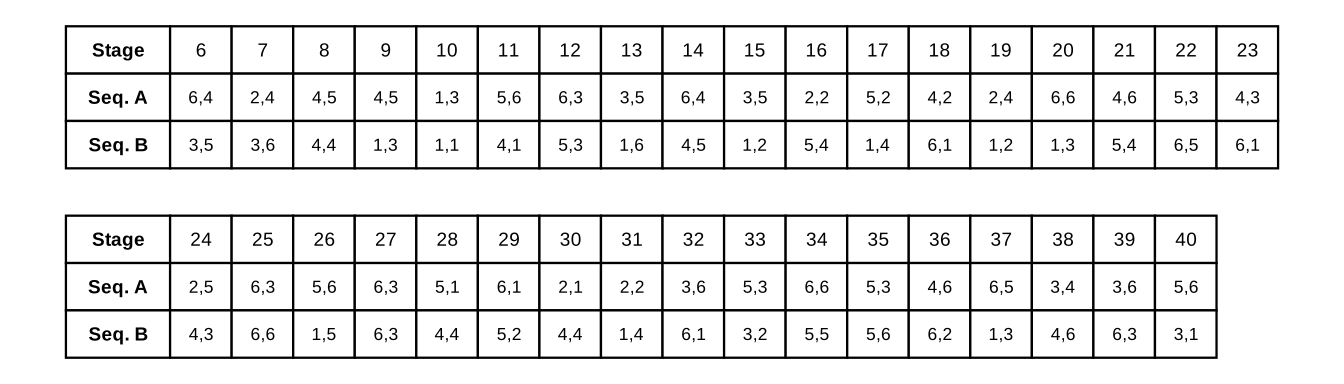
NB Just in case you really cannot find any dice to use then I have provided below a couple of sample sequences of dice-throws for you to choose between and use instead. Note that both of these sequences begin at Stage 6: I’ll be providing the first five stages for you this afternoon when I shall use them for demonstration purposes.
Describe this diagram
Two pre-recorded sequences of dice-throw outcomes (Seq. A and Seq. B), provided as a fallback for any reader without physical dice. Each sequence lists the values from Stage 6 onward — the first five stages will be supplied separately for demonstration. Each cell holds a pair of dice values (e.g. “6,4” means die-1 showed 6 and die-2 showed 4). The 35 stages are split across two horizontal blocks for legibility: Stages 6–23 in the upper block and Stages 24–40 in the lower block. Either sequence can be used in place of throwing dice live during the Funnel Experiment.
Describe this diagram
The 20–40 track at print size, in two vertical strips ready to be copied onto card and cut out: one running from 20 to 30, the other from 30 to 40. The squares alternate green and yellow with red borders, and the target-point 30 is marked with a bullseye at the end of each strip. Joining the two 30s one on top of the other makes the single 20–40 track. To the right of the strips are three funnel icons and three marble images, each at a different size, so you can choose whichever pair suits the track you build.
Describe this diagram
Four further strips in the same style, for the occasions when the funnel or the marble goes outside the 20–40 range: 0 to 10, 10 to 20, 40 to 50 and 50 to 60. Each strip repeats the square it shares with its neighbour — 10, 20, 40 and 50 — so it can be attached to the main track in the same way, one square on top of the other.