MAJOR ACTIVITY 8-d
~ 14 min reading + activities
MAJOR ACTIVITY 8–d
TABLE ONE
NB As previously recommended, in order to avoid the need to frequently turn pages backward and forward as you are developing the tables, it is more convenient to use single-sided copies of the tables that have been reproduced on pages 29–33, at the start of the Major Activity. Also, if later you would like to consider four areas rather than three, the appropriately amended tables are on pages 34–38, also at the start of the Major Activity.
Step 1. Firstly, here and in the other four tables, write the names of your three chosen areas (see page 14, in the Introduction to the Major Activity) in the coloured sections.
Step 2. Now decide on some “options”—strategies, decisions, behaviours, etc—which each of the three areas in turn might consider adopting. If the organisation is indeed at the dark end of the spectrum, it is highly likely that at least some of those options will cause difficulties to one or more of the other areas (and elsewhere in the organisation). An example might be the Purchasing Department changing to a cheaper supplier. Another could be Administration coming up with a more complex paperwork or computer system—fine for their own purposes, but a pain for everybody else! So, at this initial stage, you need to be thinking of options which are adopted by the various areas in their own narrow self-interest. If you like, refer yet again to Deming’s paragraph on page 11, in the Introduction to the Major Activity for examples. Also, initially with this exercise, it makes sense to only include matters that are reasonably within the realms of possibility; it might be interesting in a later attempt to be more imaginative and see what happens then! Write your chosen options in the appropriate spaces in the left-hand column of Table One.
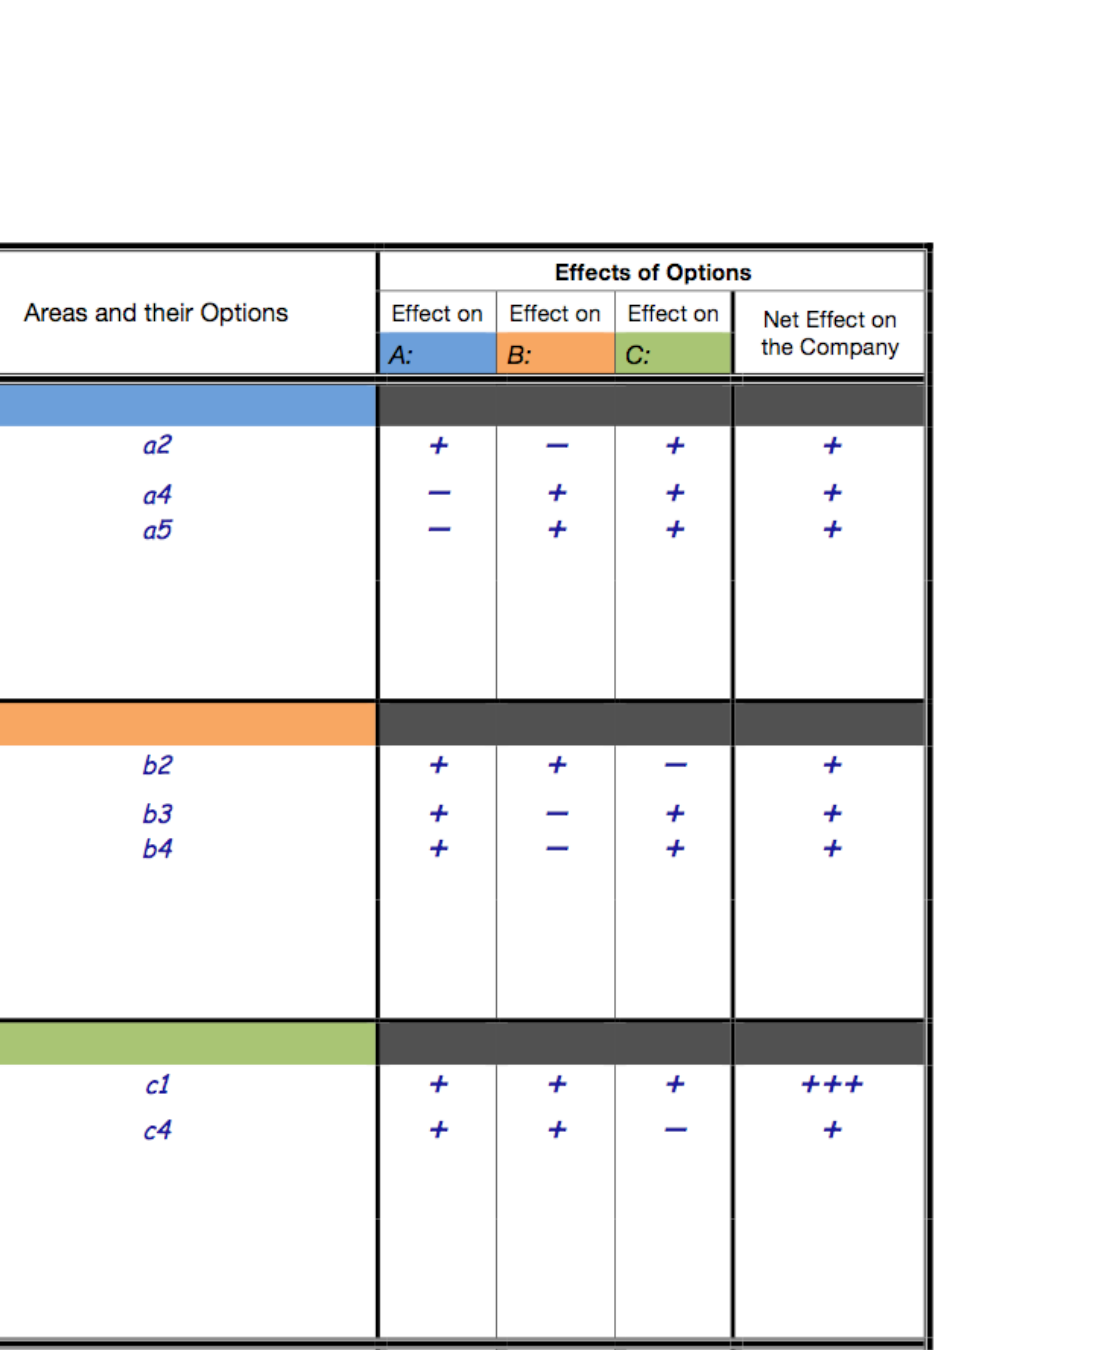
Step 3. Then, in the relevant “Effect on” columns, indicate the fact that all the chosen options are perceived as gains to the areas adopting them. Remember again that here we are in the first of the three phases and so each area chooses options which its representatives judge to be in the area’s own self-interest. However, with the extended scheme, now use +, ++ or +++ to indicate the level of gain anticipated. Also remember that it is, of course, unrealistic to imagine that we could predict an actual value for any particular gain—Lloyd Nelson’s “unknown and unknowable figures” are highly likely to be involved.
As mentioned, the tables for the DemDim case are reproduced on these left-hand pages just as a reminder. If in doubt about anything, check back to the discussion accompanying these tables where you first saw them.
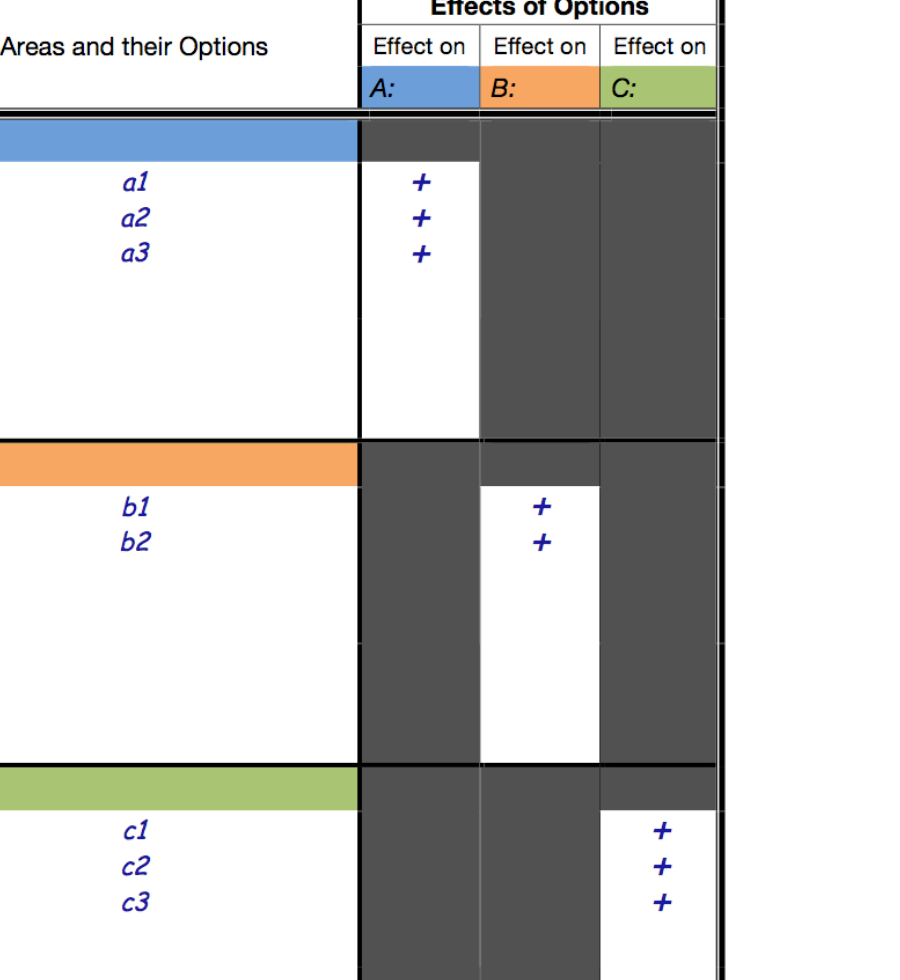
Describe this table
A small inset reprise of the worked Table One from the previous chapter: three areas (A blue, B orange, C green) each show their adopted options (a1–a3, b1–b2, c1–c3) marked with a single + in their own “Effect on” column, off-diagonal cells greyed out. It sits alongside the activity step as a reminder of what the DemDim example looks like at this phase. Tables Two through Five reappear as similar margin insets later in the chapter, each showing the corresponding worked stage of the exercise; the layout convention is identical to Table One.
TABLE TWO
Step 4. Next, simply copy everything you have written in Table One over to Table Two, placing everything exactly where it was in Table One.
Step 5. In the second of the three phases, attention now begins to be paid to the effects of these options on the other areas rather than just on the area that can adopt the option. Such an effect might be positive (advantageous) or it might be negative (disadvantageous) or it might make little or no noticeable difference to another area. In this latter case, insert a 0. Otherwise indicate moderate, large or very large advantage by +, ++ or +++ respectively. Or, of course, if the option is disadvantageous to the other area then indicate moderate, large and very large levels of disadvantage by −, −− and −−− respectively.
Step 6. Finally, as shown in the table below and also in DemDim Figure 46, insert row totals in the right-hand column, column totals in the bottom row, and the grand total at the bottom right of Table Two. In our example it has turned out that there were exactly the same number of + signs as − signs in the final column (and in the bottom row), resulting in the grand total of 0 at the bottom right. In general, count up how many more + signs there are than − signs, or vice-versa. For instance, if there were six + signs and two − signs then you have 6 − 2 = 4 more + signs than − signs; I suggest you represent this by writing + + + + at the bottom right. However, sadly there could instead now be more − signs than + signs. So if there were, say, four + signs and seven − signs in the final column (and bottom row), i.e. 7 − 4 = 3 more − signs than + signs, I suggest you represent this by writing − − − at the bottom right. The entries elsewhere in the final column and the bottom row are obtained similarly by counting the + signs and − signs in the rows or columns respectively in the body of the table.
You could of course simply represent these net results of the counts by writing e.g. something like +4 rather than + + + +; however, to write + + + + has a greater visual impact! That is especially the case when comparing the entries at the bottom right that you get when progressing through the three phases—as you already saw while working through pages 14 to 17, in the Introduction to the Major Activity.
It is worth noting that, as a check on your arithmetic, the total number of + signs and − signs in the bottom row should, of course, be exactly the same as in the final column. Both counts represent the total net number of + and − signs in the body of the table to be indicated in the bottom right box, i.e. to the overall net effect on the organisation of the choice of options now being adopted.
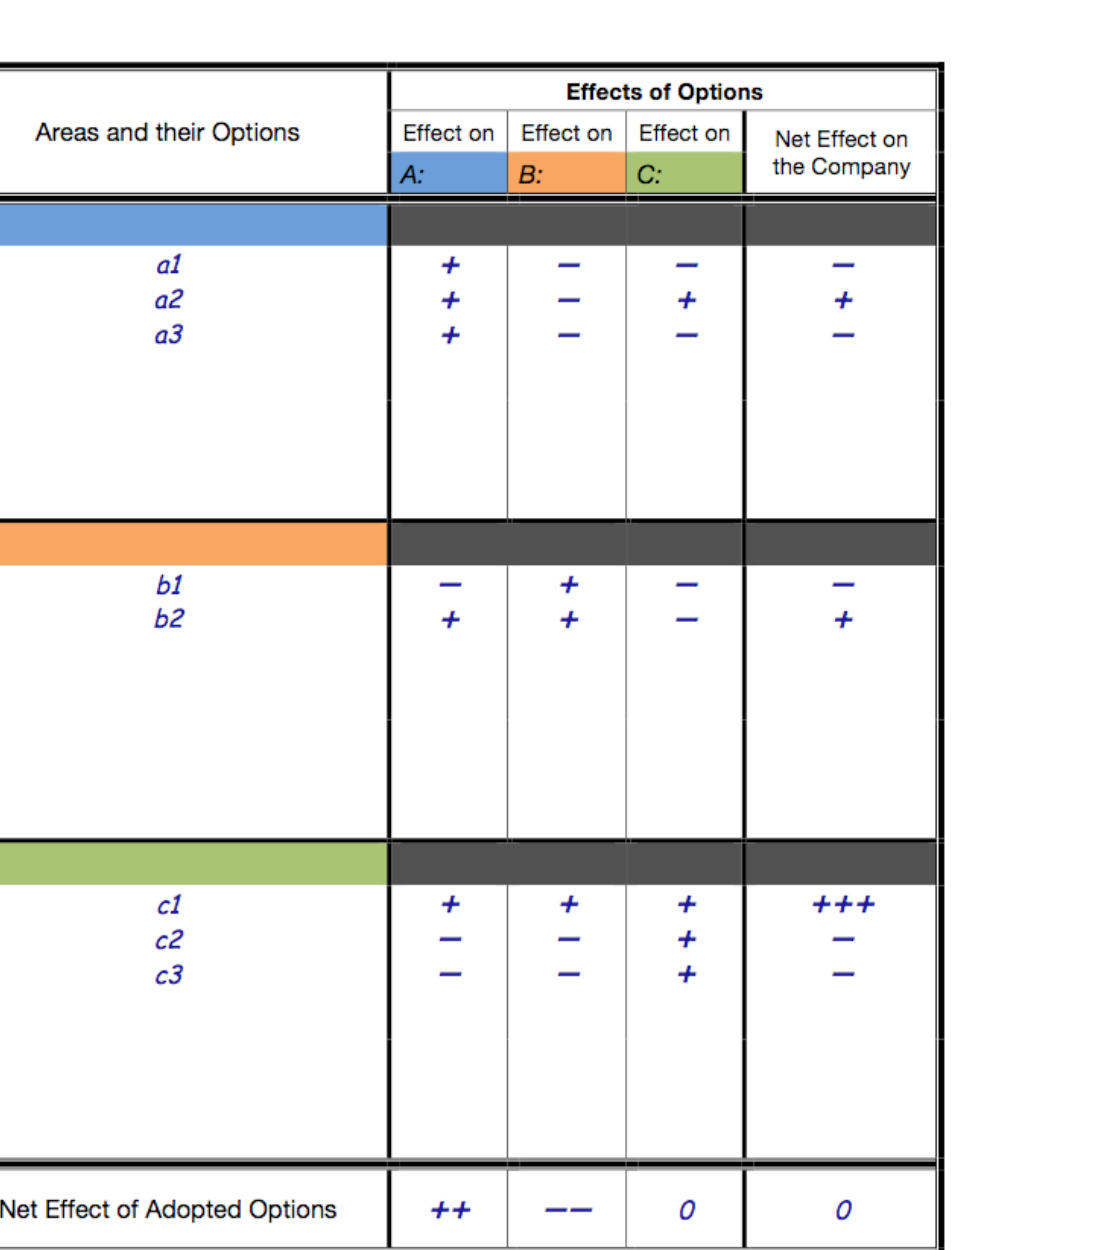
TABLE THREE
Step 7. The second phase isn’t quite finished yet. The final stage is to copy information from Table Two into Table Three—but not all of it! Just copy over only the rows with a positive “Net Effect on the Company”—i.e. those having one or more + signs in the final column.
Step 8. Step 7 included copying over the relevant row totals into the final column. Now complete Table Three by adding up and inserting on the bottom row the column totals and then the grand total, just as you did in Step 6 for Table Two.
What will you see? In the second phase, fewer initiatives will have been put into effect—yet the organisation as a whole will now be better off. Can’t be bad! But that’s what happens as the result of decisions that benefit the organisation as a whole rather than those which are adopted by simply considering sectional self-interest.
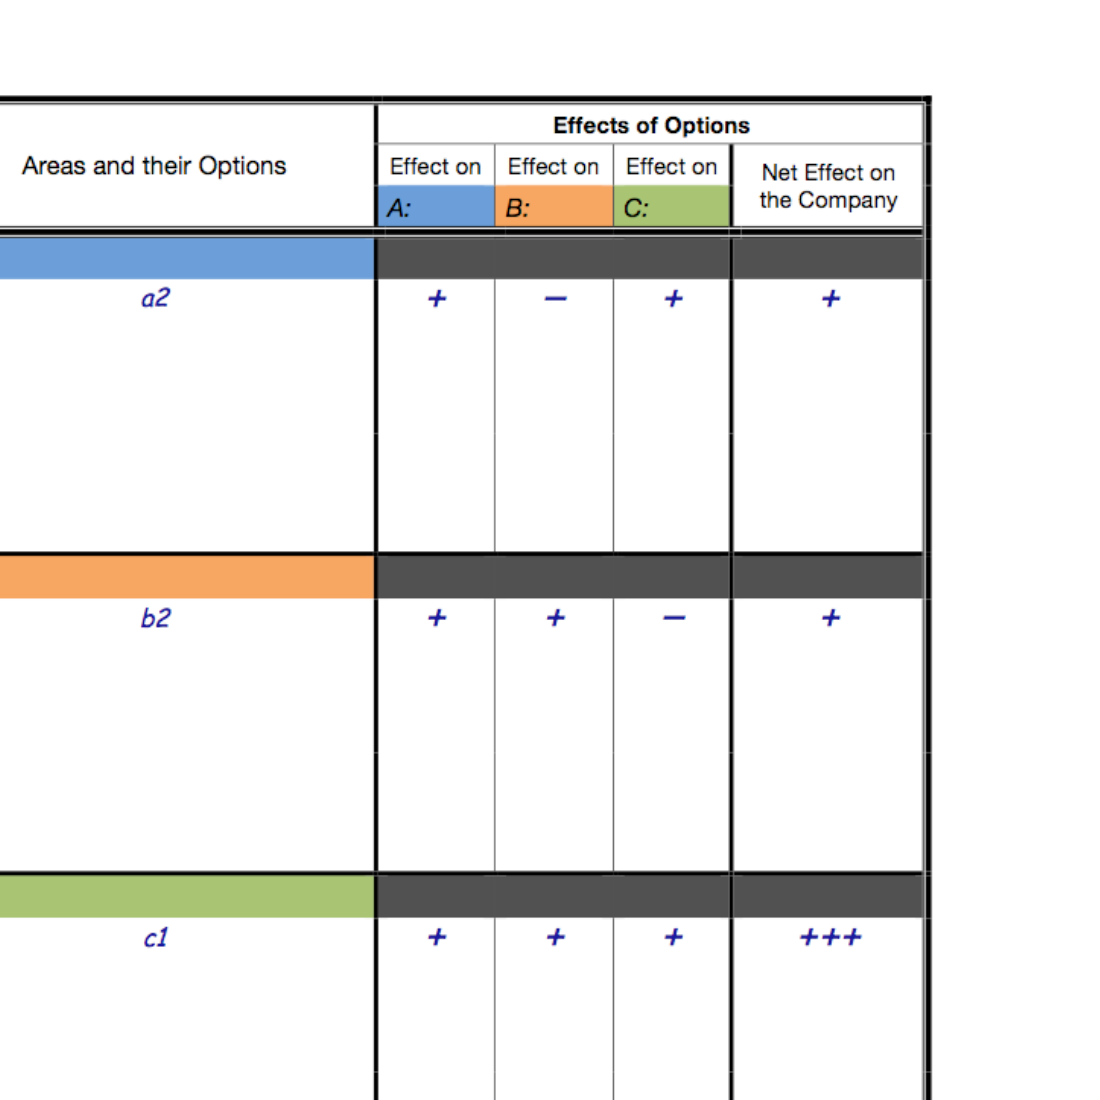
TABLE FOUR
Step 9. And now we reach the third phase—the unconventional phase (to put it mildly) from the viewpoint of the Old Climate. Start thinking about some decisions that could be made which (a) would be regarded as disadvantageous to the area concerned (were it still being measured and judged as in the Old Climate) but which (b) would nevertheless be beneficial to some other areas of the organisation. (If it would be helpful, recall the description of the “third phase” that you saw halfway down page 12, in the Introduction to the Major Activity and Deming’s description on page 15, also in the Introduction to the Major Activity about judgment of components in a system.) In this third phase, Purchasing will now start buying on the basis of total cost to the company in terms of value, dependability, reliability, ease of use, etc rather than just the initial cost. Here, “initial cost” simply means what Purchasing pays for it (perhaps as little as possible!) and “total cost” = initial cost + cost in use (for failures, breakdowns, repairs, etc). Administration may begin thinking of reducing some of the paperwork or computer-time burden which it has been imposing on the rest of the company, a reduction which might cause a little inconvenience to the Administration Department itself but with which it is able to cope in the general interest. If Sales were one of our chosen areas to include in this Activity, perhaps it could cut down on the traditional end-of-the-month push to inflate its figures that has always caused so much scheduling difficulty to the Administration and Delivery Departments. And so on.
Actually, when beginning to think this way, you might even realise that, in some cases, the area implementing such an option might not be making as large a sacrifice as originally imagined. For example, the people in the Administration Department might realise that, by reducing the paperwork or computer-time burden for others, of course there isn’t then so much for them to wade through. As a result, they might discover a better and more efficient way of dealing with the issue that they hadn’t thought of before—because they hadn’t needed to think about it before (“We’ve always done it that way”). And salespeople might find their lives become more pleasant after smoothing out their workload rather than indulging in the usual frantic end-of-the-month hiatus: less complaints from Administration and Delivery—and customers—and maybe also from their families!
So now start inserting these new options in the body of Table Four. As before, write each option in the part of the left-hand column of the table corresponding to the area which would be responsible for implementing the option and then, again as before, decide what + signs, − signs and zeros would be appropriate in the adjacent columns. The obvious difference from previously is of course that now an area’s own column will contain some − signs.
Finally, insert row totals in the right-hand column.
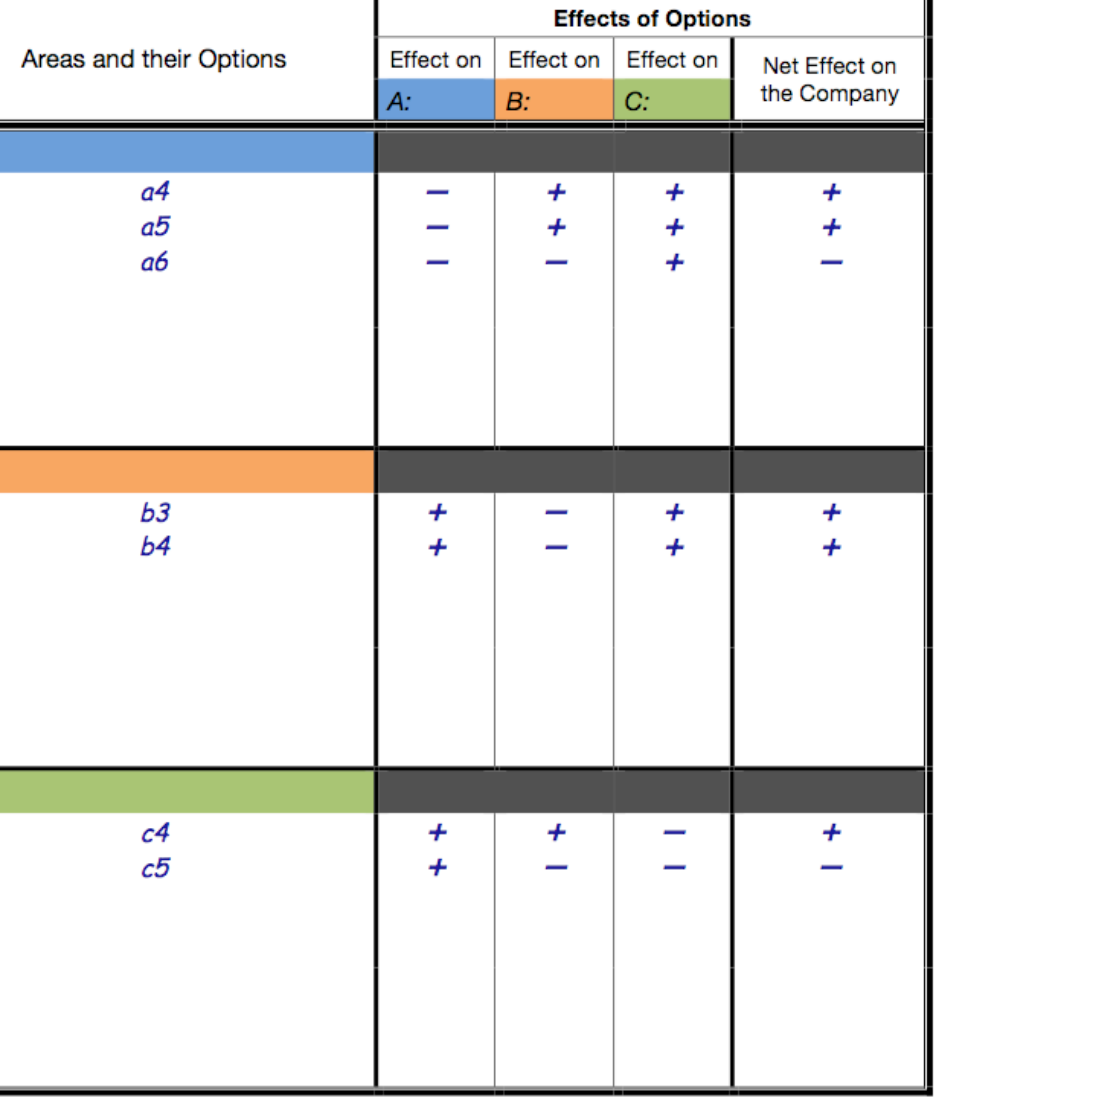
TABLE FIVE
Step 10. Now copy over everything from Table Three except for its bottom row onto Table Five.
Step 11. Next (similarly to how you formed Table Three from Table Two) copy information from Table Four into Table Five—but not all of it! Remember? Yes, you’ve got it: copy over only those entries having one or more + signs in the final column. You’ve now made the sensible decision not to adopt options unless they would produce overall gain for the organisation.
Step 12. Finally, add up and write the new column totals and the grand total in the bottom row. Take a look at that grand total …
… and then consider well the lessons to be learned from what you have done.
On page 17, in the Introduction to the Major Activity I made a big point of emphasising that the “grades” allocated to options in this exercise are made according to “Old Climate” judgments. However, you will surely have realised before now that, by the time we reach the third phase—i.e. a good level of understanding and appreciation of the fundamentals of Dr Deming’s teaching—such judgments have become out-of-date and inappropriate. By this stage, if you are in an area considering adopting a particular option, you now regard that option as having added value if overall it is going to be useful to other areas and thus to the organisation as a whole. Therefore, with this different mode of thinking, even if you had previously been regarding this option as deserving − signs, it is now less negative or may even have switched over to deserving + signs!
So what would then have happened to that “heap of + signs” referred to on page 16, in the Introduction to the Major Activity? It would have grown into an even larger heap than in your Table Five! Now you are really beginning to understand what Deming meant by that word “transformation”. The contrast between (a) decision-making and its consequences focused on sectional self-interest, and (b) decision-making and its consequences focused on the interests of the organisation as a whole, is massive. This difference will be further studied and developed tomorrow morning (Day 9).
However, for the purposes of this Major Activity here, i.e. as a teaching and learning exercise, I think it is safer to stick to the “Old Climate” judgments. If “New Climate” decision-making can produce such an improvement as seen in Table 5 despite retaining “Old Climate” judgments, even those who have not progressed very far into understanding Deming’s teaching can hardly deny that they have something to learn!
In case it is not already obvious, take a little time to think about that phrase “Huge Financial Advantages” in the title of this exercise on DemDim page 232. I’ll give you a couple of pointers. First, how did I describe those “Old Climate” judgments which give rise to all the + and − signs in the tables—including Table Five here and Figure 48 in DemDim? The + signs represent less time spent, less hard work, less inconvenience, while − signs represent the opposite. Immediately we see that all those + signs are freeing up resource that would otherwise have been spent relatively fruitlessly in the first phase. Instead, that extra resource can now be fruitfully spent on improvements and innovation leading to better quality and productivity. That strikes me as being “financially advantageous”! And second, the one major component of the New Climate that I haven’t mentioned here is Joy in Work. But does not every extra + allocated to an area contribute to enhanced Joy in Work in that area? This exercise is closely related to everything that has been raised during DemDim Chapters 13, 14 and 15, and hence is indeed a fitting conclusion to the book’s Part 3.
Having carried out this exercise, you may already be thinking of ways it can be improved. That’s fine: even with the increased choice of “grades”, this was still a relatively simple version in order to introduce the idea to you and get you started. For example, unless your organisation is small, there will presumably be other areas that you have not included, and therefore extending the tables in order to include other such areas is likely to be worthwhile. Remember that pages 34–38, at the start of the Major Activity contain the tables for a four-areas case. A particularly interesting possibility would be to include your organisation’s senior management as the fourth area along with the three areas you have involved so far. After all, we are studying Dr Deming’s theory of management! You may have already thought of other possible refinements. There may be time this afternoon for you to try out the exercise again. If not, keep such possibilities in mind for when time permits on some future occasion.
“Out-of-hours” note
It would be very handy during Day 9’s Major Activity for you to use separate copies of Day 9 pages 13–14 at Stages 3 and 4 of that Activity. The reason is that, during the final (fifth) stage of the Activity on Day 9 page 15, you will frequently find it necessary to refer back to what you’ll have previously constructed at Stage 3 and discussed at Stage 4. You will also need a separate copy of Day 9 page 29 (you’ll see the reason for this near the bottom of Day 9 page 27).